Raster-based GIS data guide economic pipeline construction
Raster-based GIS routing models prevent pipelines from becoming an economic burden on the companies and countries involved in their construction and operation by minimizing not just the economic costs, but also the environmental and social costs of any new project.
Reducing pipeline construction costs, potential environmental damage, and construction time requires appropriate route planning. Planning should analyze all factors that will affect the route. Frequent changes of surface (land use, topography, streams, etc.) and underground (soil, geology, etc.) characteristics result in a dense data set. Geographical information systems based on raster data models can efficiently manage and analyze this data.
This article presents the raster-based GIS model developed for pipeline routing and lists the model’s advantages in pipeline implementation. Routes defined with network analysis techniques over raster-based GIS models minimize economic, environmental, and time costs, depending on the quality of data used.
Background
Route selection is the most important step in the pipeline planning process; affecting technical, economic, sociological, and time components of the project as a whole.1 This primacy requires defining the factors affecting route selection and weighing these factors, organizing the resulting data into a usable database. GIS technologies allow these steps to be taken in the integral manner required to make accurate routing decisions (OGJ, June 22, 1998, p. 63).
Studies using GIS technologies to examine the physical, environmental, political, social, economic, and legal factors affecting the planning and operation of pipelines have used the factor and weight principle.2 3
Some studies compare the cost of routes selected using conventional methods (economic, social, and time costs) with the costs of routes selected using GIS-based models.2 Other studies have selected the most appropriate route among several alternatives by using GIS techniques. Studies have also used only one or a few of the important factors affecting pipeline route selection, ranging from fault lines4 to landslide areas (OGJ, Jan. 1, 2007, p. 58).
Turkey offers important pipeline passage opportunities in terms of both operational guarantees and geographical location. The acceleration of natural gas pipeline construction activities in recent years has also expanded the use of natural gas in Turkey. Despite the high level of activity, however, pipeline routing has remained largely non-automated.
Turkish pipelines have so far used conventional methods and standard topographic maps. Manual routing defines the straight line between the reserve and the target destination. Topographic maps guide when the line is allowed to depart from the straight line within limits of a corridor. Such processes can slow or even stop pipeline projects, particularly if an unexpected sharp turn, excavation, or other labor-intensive maneuver is required (OGJ, Aug. 21, 2006, p. 57).
Unnecessary stream, highway, or railway crossings increase the construction costs, duration, and operational costs of the project. Safety costs, including those brought about by unexpected landslide zones, are foremost among those associated with the last. Undetected environmental factors (underground waters, soil type, geological structures, etc.) may also require maintenance and repair earlier than had been anticipated in design (OGJ, May 29, 2000, p. 68).
Failure to account for factors affecting routing can negatively affect construction activities, operation, and life cycles of the pipelines. Avoiding these negative outcomes required that Turkey develop an efficient GIS-supported routing method for pipelines.
Two different processesusing vector or raster data modelsguide GIS routing. Thematic cost calculation, design and modeling simplicity, and ease of incorporating remote sensing data make raster-based routing the preferred process.3 5 6 Raster-based network analyses can also guide routing on surfaces where no defined routes exist, in networks composed of layers lacking attributes of the concerned features, and in artificial directional limitations. Scientific research demonstrates that raster-based methods more effectively address surface routing problems when compared to vector-based networks because surface routing is performed as a cell-to-cell connection, not as a straight line.7-10
This article first examines the applicability of current raster-based analysis models to routing pipelines in Turkey, exploring the models’ simplicity and flexibility before turning to an example of its use in pipeline routing. Research determined subjects of study area and their weight before transferring the required data for processing and analysis.
A case study shows advantages of the model when compared with classical routing methods, comparing the route of a current natural gas pipeline with the optimal route defined by the model in terms of cost and environmental exposure.
Materials, methods
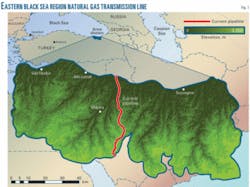
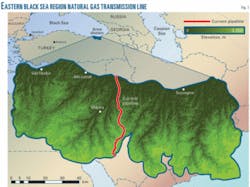
Trabzon province, in Turkey’s Black Sea region, served as the study area (Fig. 1). The province measures 4,660 sq km and has a population of 975,137. It has a rough topographic structure, with areas other than agricultural lands either covered with forest or barren.
Botas built the Eastern Black Sea region natural gas transmission line, using conventional routing. The studied length of pipeline measures 46 km. Routing the pipeline through landslide areas, as well as unnecessary streams and road crossings, caused a budget overrun and failure to complete the project according to the schedule.
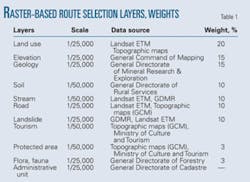
A Landsat ETM+ satellite image dated Sept. 19, 2000, defined land cover11 with a controlled classification method that used a maximum likelihood algorithm, producing 10 land cover classification maps. These maps include areas with pasture, water, deciduous and coniferous trees, mixed wood trees, green tea fields, hazelnut orchards, rocky areas, settlements, and agricultural areas. Standard topographical maps of 1/25,000 scale produced by the General Command of Mapping provided digital height data for the region. Table 1 shows other data used, with scales, data sources, and weighting.
High elevations and uneven topography created problems during pipeline construction. Only 16% of the studied area sloped less than 10°, 43% of the area sloped 10-50°, and 40% sloped more than 50°. Divided more broadly, a quarter of the study area sloped less than 30°, and the remaining three quarters sloped more than 30°.
Considering land use, agricultural activities, and other factors, a pipeline route should meet the following criteria:
- Due to diversity of flora and fauna, a pipeline should not pass through any area that is the habitat or breeding place of a threatened species.
- To ensure optimal use of resources, the number of passages over highways, streams, lakes, and rocky places should be minimized.
- To minimize sociological problems, pipelines should be kept away from highly-populated areas and recreational areas.
- To extend operational life and decrease maintenance and repair costs, pipelines should not pass through geologically unfavorable areas or landslide areas.
- To optimize construction and operation, the pipeline should be close to main roads and easily meet its own energy needs.
Table 1 lists data layers created in raster format and their weights; the material necessary to perform an integrated route analysis.
Raster-based routing
Optimal pipeline routing rests on an integrated examination and analysis of all data. A raster-based GIS model depends on collecting all factors that would affect routing on a single raster-based surface. Each pixel on this surface has a digital value representing cost of pipeline works. These digital values and direction-distance data determine optimal pipeline routing.
An interface based on the proposed model examined its applicability. Development of the interface used the C# software language and ArcGIS 9.2 software, allowing the user to choose which factors determined route selection. Users can increase or decrease the weight of any factor on the basis of cost criteria. The user can enter areas that will definitely act as barriers (flora and fauna areas to be preserved, active erosion areas, fault lines, etc.) in advance, effectively defining the route. The user can also define stops between the start and end of the route.
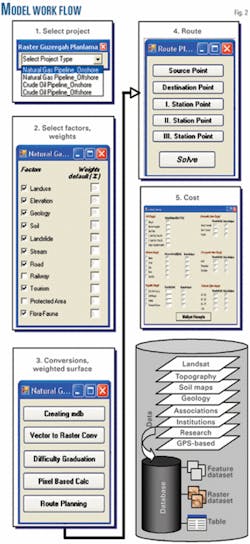
The interface then allows calculating the cost of alternative routes. Finished pipeline projects and their cost reports provide unit costs. Fig. 2 shows the work flow of the model and the process steps of the database.
Case study
Basic steps for finding a minimum cost path over a surface partitioned into regions of different resistances include:12 13
- Creating a friction surface for each evaluation criterion, where each cell in the grid is assigned a value based on the relative cost of traversing that cell.
- Weighing and combining multiple friction surfaces to create a cost-of-passage surface, representing the total cost associated with traversing each cell.
- Using a spreading function to combine separate grids representing source points and destination points with the cost-of-passage grid to calculate an accumulated cost surface.
- Tracing the lowest cost line down the accumulated-cost-surface from a departure point to a destination.14
Testing the model required attempting to optimize the route of current gas pipeline with it. Process steps for the optimum route defined over the model include:
- Type of project, factor selection. The first process step is defining the type of pipeline planned. According to the type of project selected, the user receives factors that affect the route and factor weights as defaults. The user can select any of the factors over this interface on the basis of the existing data and can change factor weights according to the details of the project. Classifying data into a geo-database organizes them for use in this step.
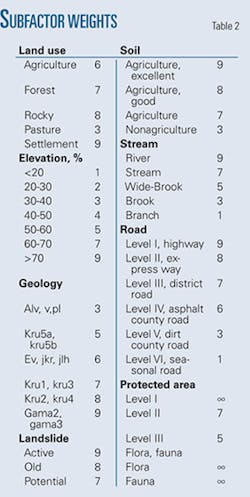
- Raster conversions, classification. The model then makes projection conversions for the vector-based positional data organized in a database and converts data into raster format. The data scale (pixels of the pipeline used equalled 50 × 50 m) allows adjustment of the required pixel dimension identification. Sub-factor classifications (complexity grading) required for the data converted into raster format occur automatically in line with data obtained from current engineering activities and operations (Table 2).
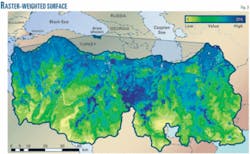
- Pixel-based calculation, weighted surface. Factor weights and classified raster data layers enable pixel-based mathematical calculations, obtaining the weighted surface showing pipeline construction costs (Fig. 3).
- Absolute-relative barriers. Obtaining the weighted surface allows the areas absolutely impossible to be passed and the areas with high passage costs to be modeled as barriers on the surface. This step used ∞ value in subunit classification for absolute barriers (earthquake areas, flora and fauna areas, etc.). An algorithm prevents the route from passing over pixels to which this value is assigned. A value of 9, assigned to places with high passage cost (roads, streams, and erosion areas), means passage is quite difficult.
- Source, destination, stops. A user can model the route’s source, destination, and stops on a weighted surface. The model marks related points for this procedure and records them in the database as a separate file. This process step allows the route points over the interface to be shown (Fig. 2).
- Optimal routing. After these interim procedures, a cost distance algorithm using ArcGIS 9.2 software generates the final route. Fig. 4 shows the optimum route defined by these steps.
null
Route examination
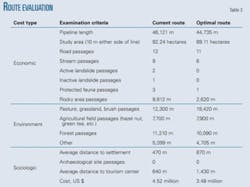
Model development first subjected the current route to evaluation of economic, sociologic, and environmental factors affecting route selection. Route data guided passage characteristics increasing cost (Table 2). Distance and population data provided the basis for examining environmental damage caused by the route and social problems resulting from proximity to settlement areas.
Calculations on the 10 m either side of the pipeline route determined 22 hectares of forest and 15 hectares of agricultural field (hazel nut and green tea) were damaged and detected three passages over landslide areas, 13 passages over highways, and 9 passages over streams. The average distance from the pipeline of 18 settlements measured 470 m. The optimal route would damage 20 hectares of forest and 15 hectares of agricultural fields, crossing 11 highways and 6 streams. It lies 870 m from settlement areas (Table 3).
null
Results
Construction costs of the optimal route run nearly 23% lower than construction costs of the constructed route. The lower number of streams, highway passages, and passages over landslide areas in OR than in CR drives the cost difference. Other factors affecting cost include elevation differences, geological elements, and soil structure. OR passes through fewer forests and biologically important fauna areas than CR. The shorter route length also causes less damage to the environment. OR also maintains a 1,430-m distance from tourist areas.
References
- Husdal, J., “Corridor AnalysisA Timeline of Evolutionary Development,” PhD thesis, University of Utah, 2001.
- Rylsky, I.A., “Optimization of Pipeline Routes Using GIS-Technologies,” Vestnik Moskovskogo Universiteta, Seriya 5: Geografiya, Issue 4, p. 34, 2004.
- Saha, A.K., Arora, M.K., Gupta, R.P., Virdi, M.L., and Csaplovics, E., “GIS-Based Route Planning in Landslide-Prone Areas,” International Journal of Geographical Information Science, Vol. 19, No. 10, p. 1149, 2005.
- Cluff, S.L., Page, A.R., Slemmons, B.D., and Crouse, B.C., “Seismic Hazard Exposure for the Trans-Alaska Pipeline,” Earthquake Engineering 2003, Advancing Mitigation Technologies and Disaster Response for Lifeline Systems (TCLEE Monograph No. 25), 6th US Conference and Workshop on Lifeline Earthquake Engineering, Long Beach, Aug. 10-13, 2003.
- Yomralioglu, T., “Cografi Bilgi Sistemleri Temel Kavramlar ve Uygulamalar,” 3rd edition, Iber Ofset, Trabzon, 2005.
- Çevik, E., and Topal, T., “GIS-Based Landslide Susceptibility Mapping for a Problematic Segment of the Natural Gas Pipeline, Hendek (Turkey),” Environmental Geology, Vol. 44, pp. 949-962, 2003.
- Moghaddam, K.H., and Delevar, R.M., “A GIS-based Pipelining Using Fuzzy Logic and Statistical Models,” International Journal of Computer Science and Network Security, Vol. 7, No. 2, p. 117, 2007.
- Rosado, R.J.I., Jimenez, F.A.L., Garrido, G.E., and Santamaria Z.P., “Advanced Model for Expansion of Natural Gas Distribution Networks Based on Geographical Information Systems,” Power and Energy Systems, p. 280, June 15-17, 2005.
- Austin, F.R., “Geographic Information Systems in Oil and Gas Transport,” The Oil Gas Review, Petroleum Geomatics, p. 56, 2003.
- Hakbilir, M., “Implementing the Dijkstra’s Algorithm with Priority Queue to the Path Finding Problem in Raster GIS,” MS thesis, Geodesy & Geographic Information Technologies, METU, Ankara, 2004.
- Reis, S., and Yomralioglu, T., “Detection of Current and Potential Hazelnut Plantation areas in Trabzon, North East Turkey using GIS and RS,” Journal of Environmental Biology, Vol. 27, No.4, p. 653, 2006.
- Collischonn, W., and Pilar, J.V., “A Directional Dependent Least-Cost Path algorithm for Roads and Canals,” International Journal of Geographical Information Science, Vol. 14, No. 4, pp. 397-406, 2000.
- Douglas, D.H., “Least Cost Path in GIS Using an Accumulated Cost Surface and Slope Lines,” Cartographica, Vol. 31, No. 3, pp. 37-51, 1994.
- Atkinson, M.D., Deadman, P., Dudycha, D., and Traynor, S., “Multi-criteria Evaluation and Least Cost Path Analysis for an Arctic all-weather Road,” Applied Geography, Vol. 25, pp. 287-307, 2005.
The authors
Volkan Yildirim ([email protected]) is a research assistant at Karadeniz Technical University, GISLab, Trabzon, Turkey. His research interests include raster-based GIS, network analysis, and oil and gas pipeline routing. He earned an MSc degree in 2003 and is currently pursuing his PhD at KTU. He is a member of Chamber of Survey and Cadastre Engineers.
Recep Nisanci ([email protected]) is an academician at Karadeniz Technical University, GISLab, Trabzon, Turkey. His research interests include land valuation, land readjustment, and GIS. He earned an MSc in 1998 and a PhD in 2005 at KTU. He is a member of Chamber of Survey and Cadastre Engineers.
Tahsin Yomralioglu ([email protected]) is a professor at Karadeniz Technical University, GISLab, Trabzon, Turkey. His research interests include GIS and land management. He earned an MSc in 1988 at KTU and a PhD in 1993 at University of Newcastle upon Tyne, UK. He is a member of Chamber of Survey and Cadastre Engineers.
Bayram Uzun ([email protected]) is an associate professor at Karadeniz Technical University, GISLab, Trabzon, Turkey. His research interests include land administration, land readjustment, and 3D cadastre. He earned an MSc in 1992 and a PhD in 2000 at KTU. He is a member of Chamber of Survey and Cadastre Engineers.
