Exploration maturity key to ranking search areas
This article describes a scheme for summarizing visually the spatial distribution, intensity, and productivity of oil and gas drilling for areas outside the US and Canada.
The article is extracted from a US Geological Survey circular, “Statistics of Petroleum Exploration outside the United States and Canada.”1
This circular updates USGS circulars 981 and 1096 and extends the coverage of those studies to China, Eastern Europe, and the Former Soviet Union. As with the earlier editions, the data are based on IHS Inc.’s International Petroleum & Exploration Production database.2
The analytical approach in USGS Circular 1288 focuses on exploration maturity as a key to ranking search areas. Efficient exploration strategies typically rank areas by exploration maturity. However, exploration maturity is multifaceted.
The locations and results of past and current drilling reflect the industry’s accumulated geologic knowledge of an area, but well counts alone are an incomplete measure of exploration intensity.
For example, in partially explored areas, information from a few wildcat wells can potentially condemn a large area if the data show that the occurrence of commercial discoveries is unlikely because of the timing of hydrocarbon generation, the absence of available traps, poor or defective seals, or because of the absence of reservoir-quality rocks. The degree of exploration maturity is determined by the spatial attributes of past drilling.
Exploration maturity should be defined relative to a density of drilling that, in turn, implies an approximate threshold size of an undiscovered oil or gas accumulation. An area is mature relative to a threshold size if the drilling is sufficiently dense that there is little chance that accumulations at least as large as the threshold size remain undetected in the exploration area.
Characterizing maturity
Locations in a country or basin are described mathematically as a set of grid points that represent corners of square cells that cover the country or province.
For purposes of visual presentation, each cell is scaled to cover 8 sq miles, making the corner points 2.83 miles apart. Each grid point is identified by a longitude and a latitude location. The delineated prospective area is described as the set of all (grid) points inside the area drilled that are reasonably close to wells (producing or dry).
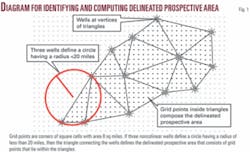
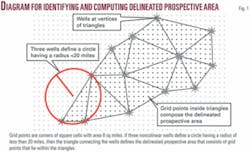
The scheme for assigning grid points to the delineated prospective area is based on well locations. Any three noncolinear wells (that is, not in a straight line) can form a triangle where the wells are the vertices, and the nonoverlapping triangles can be drawn for any set of wells (Fig. 1).
A grid point is said to be in the delineated prospective area if that grid point is located within a triangle that is small enough to fit inside a circle that has a radius of 20 miles. The delineated prospective area, in square miles, is computed as the combined area of those triangles having a well at each vertex and fitting inside a circle with a radius of 20 miles. Delineated prospective areas are displayed on maps as closed polygons.
The 20-mile radius was chosen in earlier studies because it corresponded to a convenient scale for visual presentation.3 4 The 20-mile radius is also consistent with the precision of the data on the locations of the wells and discoveries.
The delineated prospective area may expand rapidly if exploration is successful and additional wildcat wells are sited at the outer limits. The area may stabilize later as yields to drilling decline sufficiently in the newly added area or if technological barriers stop further expansion. After stabilization of a delineated prospective area, most exploratory drilling is characterized as follow-up drilling (that is, additional drilling in an already delineated prospective area).
The explored area is defined as the area consisting of the points in a delineated prospective area that are within 2 miles of a well. For example, when two wells are exactly 2 miles apart, the largest circular field that could occur between the wells would have a surface area of 3.14 sq miles. The circle would have a diameter of 2 miles, and so the radius would be 1 mile. The area would then be 3.14 sq miles.
The expected recovery from petroleum accumulations having that surface area of 3.14 sq miles varies with pay thickness and with reservoir properties. Some similar size petroleum accumulations in the US Permian Basin and Gulf of Mexico range from 12 million to 24 million bbl of oil.
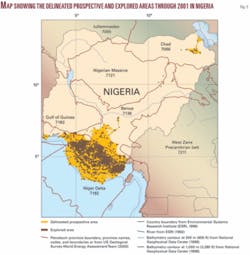
For some provinces, much of the delineated prospective area may never become part of the explored area because the delineated prospective area is unproductive and not worth further evaluation. As an example, Fig. 2 shows the delineated prospective and explored areas for Nigeria as of the end of 2001.
Grid points are assigned dates that indicate the year that each grid point entered the respective prospective area and explored area categories. With these data, profiles can be made that show graphically the additions to the delineated prospective area and explored area as a function of wildcat wells.
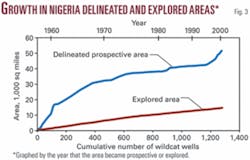
A slowdown in the expansion of the delineated prospective area appears when the rate of increase in that area is reduced causing a profile to “roll over” (Fig. 3). This profile rollover happens when exploration is concentrated within the existing delineated prospective area rather than directed at opening new areas.
Measuring productivity
Discovery rates describe yields of petroleum per unit of exploration.
These rates are commonly calculated as the aggregate volume of oil or gas in new discoveries divided by the number of exploration wells drilled during a specific time interval. For a single play having a fixed boundary, the discovery rate typically declines as progressively smaller accumulations are found.
In basins that contain several plays, if there is a sustained decline in discovery rates, then analysts will extrapolate the discovery rates to predict future finds, finding costs, and volumes of undiscovered recoverable resources. However, if the area of interest includes multiple sedimentary basins, then discoveries from new areas may offset declining discovery rates in old areas, and the overall discovery rate for the entire region may not decline during the historical data period. In this situation, extrapolation of discovery rates may not be useful.
The assignment of discovery data to grid points within the delineated prospective area can separate the confounding effects of a declining discovery rate in an old area vs. a different and perhaps increasing discovery rate in a new area. According to this procedure, each grid point in the delineated prospective area is labeled with a prospective area date, which is the year that the point became part of the delineated prospective area.
The volume of oil and gas for each discovery is assigned to the closest grid point in the delineated prospective area. The year that these grid points become part of the delineated prospective area typically precedes the discovery date of the field.
The association of oil and gas volumes to grid points and years (when the point became prospective) allows the comparison of the quality (in terms of petroleum volumes) of the new and older prospective areas. Thus, yields to drilling in old areas can be compared with yields to drilling in new areas, in order to decide whether future drilling should target sites already inside the delineated prospective area or sites in new areas.
Reported volumes of oil and gas discoveries are assigned to the grid points that are closest to the location of the reported discovery or discovery well. Then reported volumes of cumulative recoverable oil and gas are plotted against the delineated prospective area, where the increments of the prospective area are ordered by time.
If all areas are equally productive (and if follow-up drilling is assumed to be instantaneous), then the graph of cumulative oil or gas discovered vs. cumulative delineated prospective area ordered by time is a straight line. If the earlier delineated prospective area has a better endowment than the later delineated prospective area, then the shape of the graph will be concave down. Alternatively, if the later delineated prospective area has a better endowment than earlier delineated prospective area, then the shape of the graph will be concave up.
A caveat is that care should be taken when interpreting graphs that show later delineated prospective areas as less productive than early delineated prospective areas. For recently added areas, an apparent decline in the volume of discoveries per unit area could be exaggerated because of insufficient time for follow-up drilling. However, if sufficient time has elapsed without significant discoveries or follow-up drilling, then the reduced yields to drilling probably reflect the petroleum endowment accurately.
Example: Nigeria
As an example from USGS Circular 1288, Fig. 2 shows the delineated prospective area and the explored area in Nigeria based on drilling through 2001. In this figure, the delineated prospective area amounts to about 51,600 sq miles and the explored area is about 14,600 sq miles.
Fig. 3 shows the rapid additions to delineated prospective area in Nigeria from 1953, the year of first discovery, through 2001.
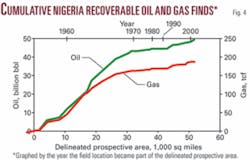
The profile of cumulative oil discoveries graphed by the year that the field location became part of the delineated prospective area shows an upturn in the discoveries (quality) of the areas associated with newly delineated areas during the latter 1990s when deeper offshore area exploration started (Fig. 4). Through 2001, fewer than 1,300 wildcat wells had been reported for Nigeria.
Summary
The study area of US Geological Survey Circular 1288, the world outside the US and Canada, was partitioned into 44 countries and country groups.
Map figures such as Fig. 2 and graphs similar to Figs. 3 and 4 provide a visual summary of maturity of oil and gas exploration. From 1992 through 2001, exploration data show that in the study area the delineated prospective area expanded at a rate of about 50,000 sq miles/year, while the explored area grew at a rate of 11,000 sq miles/year.
The delineated prospective area established by 1970 accounts for less than 40% of total delineated prospective area but contains 75% of the oil discovered to date in the study area. From 1991 through 2000, offshore discoveries accounted for 59% of the oil and 77% of the gas discovered in the study area.
References
- Attanasi, E.D., Freeman, P.A., and Glovier, J.A., “Statistics of petroleum exploration in the world outside the United States and Canada through 2001,” US Geological Survey Circular 1288, 2007, 167 pp. (http://pubs.usgs.gov/circ/1288)
- IHS Inc., “International petroleum exploration and production data base,” 2001, IHS Inc., 15 Inverness Way E., Englewood, Colo. 80112.
- Root, D.H., Attanasi, E.D., and Turner, R.M., “Statistics of petroleum exploration in the non-Communist world outside the United States and Canada,” US Geological Survey Circular 981, 1987, 133 pp.
- Attanasi, E.D., and Root, D.H., “Statistics of petroleum exploration in the Caribbean, Latin America, Western Europe, the Middle East, Africa, non-Communist Asia, and the southwestern Pacific,” US Geological Survey Circular 1096, 1993, 129 pp.
Bibliography
Environmental Systems Research Institute Inc., Rivers and water bodies [coverage], in ArcWorld 1:3M [database], Redlands, Calif., 1992, on CD-ROM.
Environmental Systems Research Institute Inc., Cntry98/Country [shape file for country and land mass boundaries], in World, Mexico, Canada, and European countries, and general US data, CD 1 of ESRI data & maps 1999, Redlands, Calif.
National Geophysical Data Center, 1988, ETOPO5 5-minute-gridded elevation data [release publicized by Data Announcement 88-MGG-02, Digital relief of the surface of the Earth]: Boulder, Colo., 1988, National Geophysical Data Center (http://www.ngdc.noaa.gov/mgg/global/etopo5.html).
The authors
Emil D. Attanasi ([email protected]) has been an economist with the US Geological Survey in Reston, Va., since 1972. He has a BA in mathematics from Evangel College, MS in statistics from George Mason University, and a PhD in economics from the University of Missouri.
Philip A. Freeman is an operations research analyst with the US Geological Survey in Reston, Va. He has a BS degree in engineering from Cornell University.
