Method calculates crude cut properties
An investigation of 28 crude samples from Russia, FSU countries, the Middle East, North Africa, and Bulgaria showed that the crude true boiling point (TBP), or ASTM D-86 distillation, density, and sulfur content, along with the Riazi’s property distribution model and known correlations, can determine the physical and chemical properties of each 1% narrow cut of the crude. The samples have densities (d420) of 0.792-0.938 and sulfur contents of 0.04-3.90%.
Crude costs, which account for about 80% of refinery expenditures, is the single most important determinant for the profitability of an oil company.1 The quality and value of a crude oil depends on its TBP curvewhich consists of white oil fractions boiling up to 360° C., the 360-540° C. fraction, and the bottom of the barrel (540+° C.)and the level of impurities like sulfur, nitrogen, metals, etc.
The TBP curve, however, does not reflect the chemical structure of petroleum fractions that in turn affects the yield and properties of refinery upgrading and conversion unit products. Knowledge of the TBP curve and the chemical nature of fractions of a crude is therefore of great importance for improving refinery economics. Unfortunately, obtaining this information requires laboratory analyses, which are costly and time consuming.
Riazi developed a two-parameter distribution model for the absolute boiling point, molecular weight, density, and refractive index parameter.2 3 Using that model and appropriate correlations allows one to determine the chemical nature of narrow crude oil fractions.
The research laboratory of Lukoil Neftochim Bourgas, Bulgaria, investigated 28 crudes with the intent to develop a tool for quick crude fraction characterization. This article discusses the results of that study.
We found that the distribution property parameter, B, in Riazi’s property distribution model was crude and property specific and not a constant for a given property, as Riazi reported. The data of crude oil TBP, or ASTM D-86 distillation, density, and sulfur content along with the Riazi’s property distribution model can be used for physical and chemical characterization of each 1% narrow cut of a crude oil.
Experimental
The TBP distillation of all 28 investigated crudes was carried out in an Autodest 800 Fisher column according to ASTM D-2892 for atmospheric pressures and according to ASTM D-5236 for vacuum pressures. The TBP distillation was performed in the Autodest 800 Fisher column at a pressure drop from 760 mmHg down to 2 mmHg and in the Autodest 860 Fisher column from 1 mmHg down to 0.2 mmHg.
The density at 20° C. was analyzed according to ASTM D-1298. The oil sulfur level was analyzed according to ASTM D-4294.
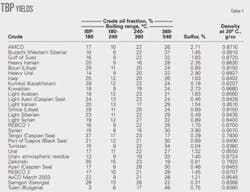
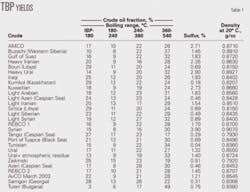
Table 1 summarizes the density, sulfur, and composition of various cuts: naphtha (initial boiling point, IBP to 180° C.), kerosine (180-240° C.), diesel (240-360° C.), vacuum gas oil (360-540° C.). The 540+° C. fraction is defined as 100%-naphtha-kerosine-vacuum gas oil.
Correlations
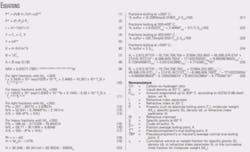
According to Riazi, Equation 1 (see equation box) describes the distribution of various properties of a hydrocarbon C7+ fraction.2
In Equation 1, x is the cumulative volume or weight fraction for specific gravity (S), density (d), and refractive index parameter (I); for molecular weight (MW), x is the cumulative mole fraction. P refers to a property such as absolute boiling point (Tb), molecular weight (MW), specific gravity (S), density (d), or refractive index parameter (I).
Equation 3 relates I to the refractive index (n) at 20° C.
P0 is the parameter specific for each property (T0, M0, S0, I0) and each sample. A is also a parameter specific for each property (AT, AM, AS, AI) and each sample.
B is a parameter specific for each property (BT, BM, BS, BI); Riazi discovered that B is the same for all investigated samples. He determined that BS = BI = 3, BM = 1, and BT = 1.5. With values of BT known for different properties, Equation 1 becomes a two-parameter distribution model in which P0 and A should be determined.3
Equation 1 can be converted into a linear form (Equation 4).
One can readily calculate the parameters A and B using Equation 4 given the boiling point, density, molecular weight, and refractive index parameter at different cumulative weight, mole, or volume fractions.
In this article, we computed the parameters A and B for the properties mentioned and for all studied crude samples by using the cumulative weight fraction.
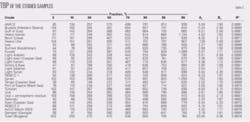
Table 2 shows the TBP distribution of all studied crude samples. Using that TBP distribution along with Equation 4 and the assumption that T0 is the boiling point of isobutane (11.6° C.), the lowest-boiling component in the crude, the parameters AT and BT were calculated.
The right hand column in Table 2 shows that the R2 correlation coefficient for all investigated crude oil samples was higher than 0.90, which shows that all crude samples boiling points obeyed the Riazi’s distribution model (Equation 1). The parameter BT for this data set, however, varied 1.56-3.36, instead of being constant value of 1.5 as Riazi reported.2
The TBP distillation of all samples was stopped at 540° C., and the higher boiling points were estimated using Equation 1. For 99% of these crudes, the end boiling point could be more than 1,093° C. (2,000° F.).4
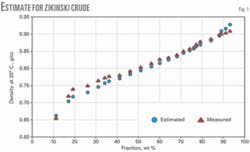
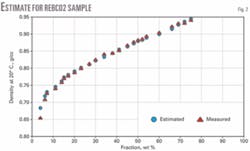
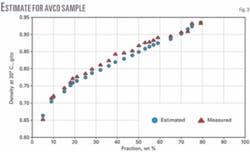
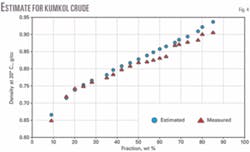
We analyzed narrow 20° C. cuts from four crude samples (Zaikinski, REBCO-2, AvCO March 2003, and Kumkol) for density. We assumed a constant Kw factor for the entire crude and estimated the densities for the fractions: IBP-180° C., 180-240° C., 240-360° C., 360-540° C., and 540+° C. These estimated densities obeyed Equation 4 and parameters AD and BD were calculated assuming d0 to be the density of isobutane (d420 = 0.56).
Figs. 1-4 show the density curves calculated based on estimated AD and BD, using Equation 1, and narrow 20° C. cuts. The average relative deviation was an acceptable 0.6-1.6%.
The density distribution for all studied crude samples assumed constant Kw and application of Equation 4 for computing AD and BD. The R2 correlation coefficient for all investigated crude samples was higher than 0.99, proving the validity of Equation 1 for density distribution.
The estimated parameter BD, however, varied in the range 2.88-5.65, which is different from Riazi’s stated constant value for BD = 3.2
There are several correlations that calculate molecular weight from the boiling point and density (OGJ, Dec. 28, 1987, p. 110).5-11 In this study, the Goosens correlation was used to calculate the molecular weight of fractions in the studied crude samples because it has shown better accuracy in predicting molecular weight in the entire crude oil boiling range.11 The Goosens molecular weight correlation is in Equation 9.
Equation 1 represents well the molecular weight distribution of fractions of all studied crude samplesthe R2 correlation coefficient was higher than 0.99 except the value for the Buzachi crude oil (0.9873). The parameters AM and BM were calculated by Equation 4 assuming that M0 equals 58 (the isobutane molecular weight). It is evident that the estimated parameter BM varied in the range 0.98-2.87 instead of BM = 1 as reported by Riazi.2
The refractive index parameter, I, was estimated using the general relation for the prediction of that parameter in Equations 10 and 11.12
As was observed with the other crude fraction properties, the parameter I also obeys Riazi’s model distribution; R2 correlation coefficient was 0.9714-0.9991. The estimated parameter BI, however, varied in the range 2.94-7.94 instead of BI = 3 as reported by Riazi.2
The refractive index was calculated on the basis of the refractive index parameter I and Equation 2.
Having readily available information about the distribution of the crude fraction refractive index, molecular weight, and density, the chemical structure of crude fractions can be calculated using published correlations.13-20 In this study, the prediction of molecular analysis by Riazi and Daubert was used to estimate paraffinic, naphthenic, and aromatic portions in the investigated crudes.20
The correlations we used are Equations 12-17.20 The hydrogen content was estimated by the Goosens correlation, shown in Equation 20.21
We found that the sulfur content can be estimated using Equations 21-24.
The carbon content was calculated as C = 100 % hydrogen % sulfur. The nitrogen content was neglected, because it is mainly concentrated in the bottoms (540+° C.).
We studied the chemical structure in terms of paraffinic, naphthenic, and aromatic portions for the different fractions for all the crude samples. Data show that for all crude samples, the aromatics in naphtha and kerosine are higher than that of diesel and vacuum gas oil. Naphthenic content is almost the same and the paraffinic portions in the diesel and vacuum gas oil are higher than that of the kerosine and naphtha.
These data suggest that the higher-molecular-weight crude fractions contain more paraffinic portions and less aromatic ones regardless of the fact that it is well known that heavier crude fractions contain more aromatic hydrocarbons. This may be explained by the suggestion that in heavier fractions, the aromatic hydrocarbons contain more paraffinic side chains.
In this data set, the highest paraffinic portion in all fractions was the Tunisian crude and the most aromatic was the Syrian crude. The Tunisian crude oil is not the lightest, nor is the Syrian the heaviest, which suggests that crude density is not a good enough indicator about the chemical composition of crude fractions.
This work demonstrates that the TBP, density, and sulfur content of a crude along with Riazi’s property distribution model can be used for physical and chemical characterization of each 1% narrow cut of that crude. If the TBP analyses are not available, one can estimate it by computing Riazi’s boiling temperature distribution parameters AT and BT using the correlations in Equations 25 and 26.
These correlations were developed via multiple nonlinear regressions of the data for the investigated 28 crude samples.
The chemical characterization of crude fractions can be used as an input to estimate refinery unit product yields and, therefore, to examine the economic benefit of processing a given crude. An earlier work showed that the vacuum gas oil chemical composition can be applied for evaluation of fluid catalytic cracking yield distribution.22
References
- Ooms, A.C., van den Berg, F., Kapusta, S.D., and Nouwens, L.W., “Processing opportunity crudes: A new strategy for crude selection,” proceedings of the European Refining Technology Conference, Nov. 12-14, 2001, Madrid.
- Riazi, M., “Distribution Model for Properties of Hydrocarbon-Plus Fractions,” Ind. Eng. Chem. Res., Vol. 28 (1989), pp. 1831-35.
- Riazi, M., “A Continuous Model for C7+ Fraction Characterization of Petroleum Fluids,” Ind. Eng. Chem. Res., Vol. 36 (1997), pp. 4299-4307.
- Kaes, G.L., Modeling of Oil Refining Processes and Some Practical Aspects of Modeling Crude Oil Distillation, VMGSim User’s Manual, www.virtualmaterials.com.
- “Molecular Weight and Watson Characterization Factor of Petroleum Fractions,” API Technical Data Book, 1964.
- “Molecular Weight of Petroleum Fractions,” API Technical Data Book Procedure 2B2.1, 1982.
- Riazi, M., and Daubert, T., “Simplify Property Predictions,” Hydrocarbon Processing, March 1980, pp. 115-16.
- Twu, C.H., “An Internally Consistent Correlation for Predicting the Critical Properties and Molecular Weights of Petroleum and Coal Tar liquids,” Fluid Phase Equilibria, Vol. 16 (1984), pp. 137-50.
- Hairu, O.H., and Sage, R.C., “Crude Split Figured by Computer,” Hydrocarbon Processing, April 1969, pp. 143-48.
- Kesler, M.G., and Lee, B.I., “Improve Prediction of Enthalpy of Fractions,” Hydrocarbon Processing, March 1976, pp. 153-58.
- Goossens, A.G., “Prediction of Molecular Weight of Petroleum Fractions,” Ind. Eng. Chem. Res., Vol. 35 (1996), No. 3, pp. 985-88.
- Riazi, M.R., and Daubert, T.E., “Characterization Parameters for Petroleum Fractions,” Ind. Eng. Chem. Res., Vol. 26 (1987), pp. 755-59.
- ASTM standard D 3238-82, “Calculation of carbon distribution and structural group analysis of petroleum oils by the n-d-M method,” 1982.
- API Technical Data BookPetroleum Refining, 2nd Edition, American Petroleum Institute, Washington, DC, 1970.
- Riazi, M.R., and Daubert,T.E., “Prediction of the composition of petroleum fractions,” Ind. Eng. Chem. Process Dev., Vol. 19 (1980), No. 2, pp. 289-94.
- Riazi, M.R., “Prediction of thermophysical properties of petroleum fractions,” PhD Thesis, Pennsylvania State University, 1979.
- Van Nes, K., and Van Western, H.A., “Aspects of the Constitution of mineral oils,” New York: Elsevier Publishing Co. Inc., 1951.
- Riazi, M.R., and Al-Sahhaf Taher, A., “Physical Properties of heavy petroleum fractions and crude oils,” Fluid Phase Equilibria, Vol. 117 (1996), pp. 217-24.
- El-Hadi, D., and Bezzina, M., “Improved empirical correlation for petroleum fraction composition quantitative prediction,” Fuel, Vol. 84 (2005), pp. 611-17.
- Riazi, M.R., and Daubert, T.E., Ind. Eng. Chem. Process. Dev. Vol. 25 (1986), pp. 1009-15.
- Goossens, A., ”Prediction of the Hydrogen Content of Petroleum Fractions,” Ind. Eng. Chem. Res., Vol. 36 (1997), pp. 2500-04.
- Stratiev, D., and Minkov, D., “Prediction of FCC Yields from Feedstock Quality Characterised by Empirical Methods,” Oil Gas European Magazine, Vol. 1 (2000), pp. 27-32.
The authors
Dicho Stratiev ([email protected]) is an associate professor and research department manager for Lukoil Neftochim Bourgas, Bulgaria. He is an author of more than 60 papers and has held several positions in research and production activities during his 17 years with Lukoil Neftochim Bourgas. Stratiev holds a PhD in petroleum refining from Bourgas University.
Rosen Dinkov is a chemical engineer in the oil refining group in the research department for Lukoil Neftochim Bourgas, Bulgaria. He works on crude oil characterization, fuel characterization, and modeling of refinery distillation processes. Dinkov holds an MS in organic chemistry engineering from Bourgas University.
Kiril Kirilov is head of the oil refining group in the research department for Lukoil Neftochim Bourgas, Bulgaria. He has held several positions in research and strategic planning during his 19 years with Lukoil Neftochim Bourgas. Kirilov holds an MS in organic chemistry engineering from Bourgas University.
Krasimir Petkov is manager of the technical and strategic development department for Lukoil Neftochim Bourgas, Bulgaria. He has held several positions in research, maintenance, and strategic planning during his 19 years with the Lukoil Neftochim Bourgas. Petkov holds an MS in mechanical engineering from the Rouse technical university and a PhD from the Technical University in Varna, Bulgaria.
