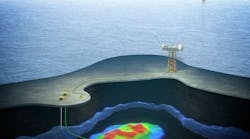
Modeling offshore energy risk presents a special set of design challenges. Actuarial techniques cannot be applied due to the relative infrequency of events and scarcity of historical loss data.
Each hurricane is unique, and the response of platforms, pipelines, and rigs in the path of each storm is also unique. To model the low frequency-high severity risk associated with catastrophic events, it is necessary to develop physical models of the event and the manner in which the event creates vulnerability and interacts with infrastructure.
The purpose of this two-part article is to review the goals of catastrophic event modeling and its application to the offshore energy industry and to quantify the expected losses to property damage in the Gulf of Mexico based on historical storm events.
Probabilistic scenarios for storm simulations are applied to quantify exceedance probability curves, average annual losses, and expected losses. In Part 1, we review the evolution of offshore energy insurance markets and the conceptual stages of model development. In Part 2, we quantify losses to property damage for historic weather events.
2004-05 hurricane season
Over the past 2 years, operators in the gulf have been blessed by uneventful weather, as most major hurricanes have bypassed the region.
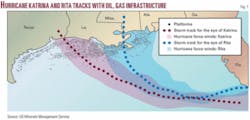
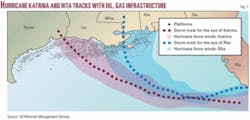
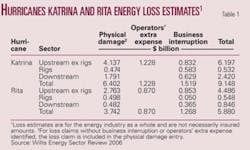
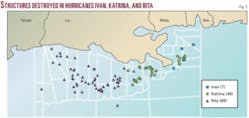
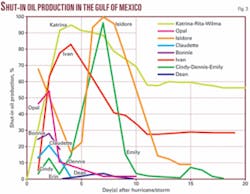
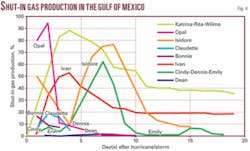
This is in marked contrast to the 2004-05 hurricane season, when Hurricanes Ivan, Katrina, and Rita caused unprecedented damage and production interruption (Figs. 1-4). Hurricane Ivan caused energy losses of $2.5-3 billion, while Katrina and Rita were responsible for a record $15 billion loss.
Extensive physical damage, business interruption, and contingent business interruption losses from the 2005 hurricane season have led to substantial increases in insurance premiums for the offshore industry and restrictions in coverage for insurance underwriters. The possibility exists that the industry could experience a comparable or greater loss in the future.
Losses incurred in a hurricane are a combination of physical damage and time element losses. Both are of critical importance because of the business need to maintain operating income. When production operations are disrupted, either by damage on site or elsewhere, cash flow is impacted.
Insurance claims on time element coverage are typically categorized as business interruption from damage to assets (e.g., platforms, pipelines, etc.) owned by the assured, and contingent business interruption, associated with damage to upstream facilities such as processing plants, trunk lines, and refineries, owned by third-parties, which prevent production from being received.
In Ivan, about two thirds of the total losses were due to business interruption and contingent business interruption, while for Katrina-Rita, physical damage was the major cause of losses (Table 1). Two thirds of the energy losses due to Katrina and Rita have been attributed to physical damage, followed by business interruption (18%) and operators extra expense (14%).
The impact of the hurricanes to the offshore infrastructure has been widely reported in the trade press, the Offshore Technology Conference, and other conferences. For Katrina, losses have been estimated at $2.53 billion onshore, $6.63 billion offshore; for Rita, losses have been estimated at $915 million onshore, $4.98 billion offshore.1
Over the past half century, operators in the gulf have responded to extreme weather events on a regular basis. In an average year, three tropical storms enter the gulf at hurricane strength, causing production to be temporarily shut-in and personnel evacuated to shore.
After the storm makes landfall, crews return to assess the damage and make repairs. If repairs are needed, they are usually made in a reasonable period of time and production quickly resumed.
It has been about a century since the gulf has witnessed two major hurricanes in one season, although in the 1960s there was a string of major storms (Carla in 1961, Hilda in 1964, Betsy in 1965, and Camille in 1969) that caused significant damage to offshore infrastructure. It was from these early events that much of today’s design standards evolved.2
Offshore insurance coverage
The offshore energy industry involves numerous operating hazards incident to drilling and producing oil and natural gas wells, such as blowouts, explosions, oil spills, and fires, as well as hazards peculiar to marine operations, such as collision, grounding, and damage or loss from severe weather.
All hazards can cause personal injury and loss of life, damage to and destruction of property and equipment, pollution or environmental damage, and suspension of operations. Operators, contractors, and service companies insure against or have indemnification from customers for some, but not all, of these risks.
Offshore oil and gas insurance can be traced to exploration activities in the gulf in the early 1960s.3 The first policies were associated primarily with the control of blowouts. As the costs of drilling escalated with more complex targets and deeper water depths, it was recognized that additional expenditures following the loss of well control would be substantial.
The London market began to cover the costs to redrill a blowout well as a separate policy from control expenditures. Over time, these two coverages merged to provide the basis of the operators extra expense (OEE) coverage.
Pollution liability policies resulted in a separate market covering clean up and containment risks. By the late 1960s, the market expanded to cover the risks of direct physical loss or damage to platforms, rigs, and equipment.
Today, two basic coverages apply to offshore installations. For fixed platforms, pipelines, and subsea developments, the market has developed an “all risks” coverage based on the London Standard Platform form. Areas of coverage include property and casualty (P&C), liability, business interruption, workers compensation, life, and health. P&C coverage is intended to provide post-loss financing for any physical property that is damaged or destroyed by an event. For floating production systems, marine policy forms such as the Institute Time Clauses Hull Port Risks, which covers maritime perils such as stranding, collision, and contacts, are in common use.
Business interruption refers to coverage for gross earnings less noncontinuing expenses, or net income (loss) plus fixed and continuing expenses. The intention of business interruption coverage is to indemnify the insured for lost net income that would have been earned had the damage to facilities not occurred, as well as for refunding fixed expenses incurred during the period of indemnity.
Contingent business interruption coverage entitles the policyholder to damages based upon loss of income due to damage to a property, which an insured business does not own, operate, or control, but upon which the insured’s income depends.
Companies purchase insurance policies tailored to their needs and asset portfolio. An operator may purchase a well control policy to cover well control cost, redrilling costs, and third party pollution liabilities, while a company with a portfolio of assets may retain its own risk through the establishment of a captive insurance company.
A mutual insurance company may be formed by oil companies to underwrite the risk, or a portion of the risk, of the owner companies. The most well-known mutual insurance firm is the Oil Insurance Co., formed in 1971 in response to a shortage in insurance capacity and high well control premiums.3
Offshore energy insurers have traditionally been defined by their willingness to take risk without relying on technical analysis. Unlike downstream insurers, which depend on risk surveys and reports conducted by professional engineers to evaluate risk and identify unknown or unquantifiable exposures, upstream insurers have not historically attempted to model or further quantify their risk.
The damage to the oil and gas infrastructure by Katrina and Rita and resulting insurance claims and large losses in the energy insurance market changed this perspective. Underwriters are now attempting to control their exposures to contingent losses through exclusionary wording or policy sublimits similar to what the downstream sector has been doing for decades.
Catastrophe modeling goals
A natural catastrophe generally results in a large number of individual losses involving many insurance policies and insured parties.4
The goal of catastrophe modeling is to allow users to estimate the probability of occurrence of an event, the upper intensity limits of a particular occurrence, and the financial loss that will result if an event of a particular intensity occurs.5
Models cannot be expected to predict when or where an event will occur, its intensity, or provide an exact assessment of financial losses. Rather, models are meant to provide a formalized framework that allows the distribution of future events and expected loss patterns to be developed so that rational pricing and risk decisions can be made.
The primary users of catastrophe models include insurers-reinsurers and other financial intermediaries that provide risk capacity, corporations with a large amount of property exposure and active risk management programs, and government agencies responsible for monitoring risk mitigation requirements.
Risk management stages
Risk management involves four stages centered on identification, quantification, management, and reporting.6
It is usually a straightforward task for a company with offshore production to identify potential exposure to catastrophic damage. Scenarios are developed to quantify the various levels of risk, from small losses due to equipment damage and temporary business interruption, to larger losses arising from total destruction. Risk can vary significantly from one location to another, depending on a number of factors, including the severity and frequency of storms, structure type and location, and differences in vulnerability.
When risks have been identified and quantified, the company will then manage the risks in ways that depend on the financial resources of the firm, operating philosophy, the expectations of shareholders, and the costs and benefits of various risk strategies. The potential cost of sustaining partial or complete destruction of a facility may be too great for a midsize firm, so the firm might decide to transfer the exposure entirely.
With major changes in insurance premiums and deductibles, a company may consider implementing a captive insurance program (self-insure), choose to increase risk retention, or join a mutual insurance company. Many companies do not insure business interruption or loss of hire risk.
After a company decides how it wants to manage its risk profile, it then monitors its exposures. Exposures are unlikely to change often, unless the operator is involved in an extensive newbuild program, field development, acquisition activity, or analysis reveals a significant change in environmental conditions or perceptions.
Risk modeling
Quantitative models using stochastic and actuarial processes have been used for decades in the banking, insurance, and corporate sectors to estimate the financial effects of high frequency-low severity risks and their impact on risk transfer/retention strategies.
To model the low frequency-high severity risk characteristic of catastrophic events, it is necessary to develop physical models of the event and the manner in which the event causes damage and interacts with infrastructure.
Model development
Catastrophic risk models are developed following three stages.5
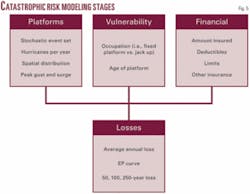
The first step is the hazard/peril assessment (Fig. 5). Hazard assessment defines events by physical characteristics (severity) and probabilities of occurrence (frequency). The event generation component is designed to generate realistic storm scenarios in accordance with their relative probability of occurrence.
The result of hazard/peril modeling is used in the vulnerability assessment phase, which estimates the degree of local/regional damage and the potential for direct and indirect losses caused to infrastructure, contents, and operating activities. The final stage is contract assessment, which determines individual and portfolio losses based on the terms of coverage.
To estimate loss in contract assessment, the policy for each asset (with coverage limits, excess points, policy limits, etc.) is obtained for well control, physical damage, business interruption, loss of hire, and removal of wreck. If the policy conditions are unknown, standard contract conditions are applied.
Event generation
The first step in creating and using a catastrophe model is to generate the events that cause the hazard.
The path and intensity of a hurricane event is modeled using meteorological data and physical equations, weather prediction models, and expert opinion. Event characteristics follow historical patterns and meteorological constraints, with primary variables of interest: frequency, storm track, minimum central pressure, maximum wind speed, radius to maximum winds, and angle of landfall.7
A hurricane can travel in any direction, with its path determined by meteorological conditions at the time of the event. Typically, a hurricane moves at speeds less than 20 mph. Storms generate waves that travel out ahead of the generating area. The most severe wind and wave action of a hurricane typically occurs in a band 50-100 miles wide centered on the path of the storm.
At each point along the storms track, the area impacted by the hurricane can be divided into four quadrants. The “dangerous quadrant” is the one in which the storm’s forward movement (translation) adds to the orbital (circular) wind velocity. As waves and swells move from deep water into shallow water, their wavelength shortens and the height increases, causing the wave to eventually break.
A wave is a traveling disturbance of the sea surface. Waves are primarily caused by the action of wind on water. Waves that have been transmitted beyond the wind-affected zone are called “swells.” The total energy in a wave is proportional to the square of the wave height; the energy of a swell is proportional to its length. Wave height is governed by wind speed, duration, fetch, and other factors, such as the temperature of the air relative to the sea.
The winds experienced at a location change direction and intensity as a hurricane approaches, and are further impacted by surface roughness upwind as the storm interacts with land. Maximum winds experienced at a particular point may not occur when a hurricane’s center of circulation is closest.
Vulnerability module
After an event is generated, it propagates across the affected area. Local intensity is estimated, based on site-specific data and engineering algorithms, and superimposed on the built environment.
The production and transportation infrastructure in the GOM is a highly integrated network, so damage to any part of the systemupstream, midstream, or downstreamcan affect the entire supply chain. Repair times depend on the extent of damage, facility location relative to support services, and availability of equipment and contractors.
Production shut-ins may be due to damage to third-party onshore facilities such as refineries, terminals, and processing stations. The costs to repair structures and the associated cash flow impairment due to delayed production, whether from a flow line or umbilical, product transport line, or onshore infrastructure, varies with each structure.
Loss due to physical damage is normally based on the estimated replacement value of the facility, along with the damage ratio. The damage ratio is expressed as the fraction of replacement cost that must be incurred to fix physical damage. Vulnerability curves that provide the mean damage ratio along with the uncertainties on the damage ratio are developed in the patented RMS Offshore Platform Model based on damage potential at a component level.
Insurance claims, as well as engineering studies of component damage to specific platforms in historical events, are used to construct the vulnerability curves. Design, analysis, and recommended offshore practice codes are also applied.7
Business interruption losses are typically modeled using restoration curves developed from a connectivity analysis.7 8 Repair times are typically estimated from historical events and validated by reference to claims and field survey data. Network redundancies in the pipeline system may allow some flows to be rerouted.9 10 Simulated event characteristics should parallel patterns observed in the historical record, but in many instances, the historical record is scant and does not provide adequate benchmarking.
Contract assessment
Offshore energy insurance contracts are more complex and sophisticated than their onshore counterparts, typically including deductibles by coverage, blanket deductibles, coverage limits and sublimits, coinsurance, attachment points and limits for multiple location policies, and risk reinsurance terms.
Total losses refer to all the financial losses directly attributable to an event irrespective of whether the losses are insured or not, including losses due to business interruption as a consequence of the property damage. Generally, since total losses are estimated and communicated in different ways, they are not directly comparable and should be viewed only as an indication of the order of magnitude.
Ground-up property loss represents loss before insurance and is frequently the preferred reporting mechanism. Gross loss is based on the application of insurance coverage.
Next week: Quantifying offshore losses to hurricane event.
References
- Willis Energy Market Review, May 2006 (www.willis.com).
- Versowski, P., Rodenbusch, G., O’Connor, P., and Prins, M., “Hurricane impact reviewed through API,” Offshore Technology Conference, OTC 18417, Houston, 2006.
- Sharp, D.W., “Offshore Oil and Gas Insurance,” Witherby & Co. Ltd., London, 2000.
- Swiss, Re., “Natural and man-made catastrophes in 2005,” Swiss Re Publishing, Zurich, Sigma 2, 2006 (www.swissre.com).
- Banks, E., “Catastrophic Risk,” John Wiley & Sons Ltd., West Sussex, England, 2005.
- Banks, E., “Alternative Risk Transfer,” John Wiley & Sons Ltd., West Sussex, England, 2004.
- “Offshore Platform Model Methodology,” RiskLink 6.0, RMS, Newark, Calif., 2006.
- Sandhu, A., “Modeling offshore energy risk,” Catastrophe Risk Management, Guy Carpenter, September 2006, pp. 14-16.
- “The effects of Hurricane Ivan on offshore oil and gas platforms, infrastructure, and production,” RMS, Newark, Calif., March 2005.
- “Impact of the 2005 Hurricanes on the Natural Gas Industry in the Gulf of Mexico Region,” US Department of Energy, 2006.
