GULF UPDATE—1: Gulf of Mexico P&A costs begin to recover from 2005 hurricanes
In the aftermath of the widespread hurricane destruction in the Gulf of Mexico in 2005, the cost of operations dramatically increased with increased demand for support services, but market conditions appear to be slowly reverting to prehurricane conditions.
This article reports on an assessment of trends in plug and abandonment costs in the US Gulf of Mexico 2002-07, based on a sample of 1,156 wells performed by Tetra Applied Technologies LP. It summarizes descriptive statistics and investigates the impact of scale economies. In addition, the article constructs relations that estimate the cost of P&A activities based on the number of wells in a job and the number of days of service.
Kaiser and Dodson have described applicable technologies and procedures and P&A cost statistics from 1999-2001.1
This is the first of two articles updating recent trends in costs of gulf P&A activities and of net-trawling operations. The concluding article will appear next week.
Regulations
Wells are drilled to explore for, delineate, and produce hydrocarbon reservoirs. At the ends of their useful lives, wellbores are permanently abandoned in a process known as plugging and abandonment. The purpose of P&A is to prevent migration of fluids from the wellbore and establish a permanent barrier to the existing geologic formation.
P&A is the first stage of an offshore decommissioning program in which tubing, casing strings, and conductors are cut and removed below the mud line and cement plugs are set at various depths across former producing horizons.
The operator designs a P&A operation based on the reservoir and wellbore conditions and applies for regulatory approval. In most states, rules have evolved over many years with standards based on experience and conformance with industry guidelines.2 3 Different governmental bodies regulate wellbore abandonment; the body with primary responsibility depends on the location of the well. Onshore and in state waters, county, city, or state government is responsible for oversight; in the federal Outer Continental Shelf, the Minerals Management Service is lead agency.
Wells in the OCS must be permanently plugged and abandoned within 1 year after the lease terminates. The MMS may require that a well be permanently plugged before lease production ceases if it endangers safety or the environment or if it is not useful for lease operations and is incapable of producing in economic quantities.4 Wells may also be shut-in or temporarily abandoned throughout their life cycles for mechanical or technical reasons or because they are not producing in economic quantities.
Wellbore inventory, classification
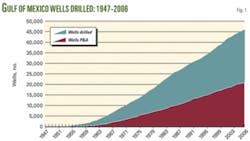
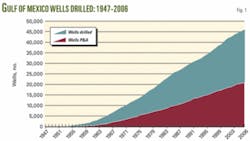
More than 46,000 exploration and development wells have been drilled in the gulf since production activities began after World War II. Slightly more than 20,000 of these wellbores have been permanently plugged and abandoned in the gulf (Fig. 1). Wells not permanently plugged and abandoned may be producing, shut-in, temporarily abandoned, or in an indeterminate status.
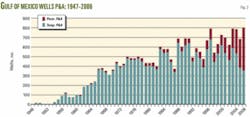
Producing wells currently represent about 20% of the wells not permanently plugged and abandoned. Fig. 2 shows the annual number of wells permanently and temporarily abandoned in the gulf. Over the past decade, 600-800 wells/year have been plugged and abandoned. After the 2005 hurricane season, a large number of wells were temporarily abandoned as operators assessed damaged infrastructure and considered redevelopment strategies.
• Well life cycle. Every well’s cost, duration, recovery, and value reflect its unique life cycle. Although these attributes are specific to each wellbore, all producing wells pass through the same initial and final states, beginning with completion and ending with abandonment.
Eventually, all wells become inactive because of diminished economic returns or technical problems.
When a well stops producing, it may be shut-in, temporarily abandoned, or permanently abandoned. The MMS provides specific regulations for each operation.
• Shut in. A shut-in well is a flowing well that has its christmas tree, master valves, wing valves, and subsea safety value closed. A well is usually shut in because of temporary technical or operational problems (e.g., wells are shut in with the approach of a hurricane).
A well can be maintained shut-in for any length of time as long as periodic maintenance is performed. MMS regulations (20 Code of Federal Regulations, Ch. 11, Part 250.801 (f)) specify that “completions shut-in for a period of 6 months shall be equipped with either (1) a pump-through type tubing plug; (2) a surface-controlled subsea safety valve, provided the surface control has been rendered inoperative; or (3) an injection valve capable of preventing backflow.”
• Temporarily abandoned. When an exploratory well is under evaluation or when a flowing well is no longer economic to produce, the well will often be temporarily abandoned. Wells on destroyed infrastructure may also be temporarily abandoned if operators intend to reenter or redrill them in redevelopment.5
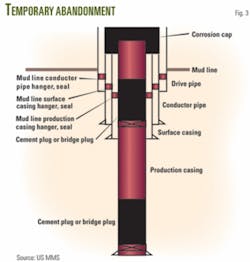
In temporary abandonment, the wellhead is removed, the producing formation isolated with plugs, casing plugged below the mud line, and a corrosion cap inserted above the mud line (Fig. 3). For wells temporarily abandoned, MMS requires the operator provide within 1 year of the abandonment and at 1-year intervals a report describing plans for reentry to complete or permanently abandon the well (30 CFR, Ch. 11, Part 250.703).
The decision to shut in a well vs. performing a tempoarary abandonment is a well and company-specific decision, depending on many considerations, including maintenance and monitoring requirements, workover costs, remaining recoverable reserves, and strategic objectives.
• Permanently abandoned. At the end of a lease’s life, when production ceases, all its wells must be permanently abandoned. A shut-in or temporarily abandoned well is a temporary or transitory stage, while a permanently abandoned well is the terminal state of a wellbore.
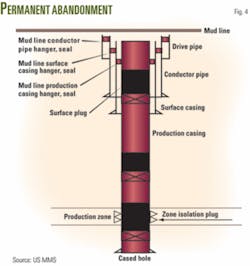
In a permanently abandoned operation, former producing horizons are plugged and casing is cut off below the mud line according to regulatory guidelines (Fig. 4). In a permanently abandoned well, there are at least two, and often three, zone isolating plugs. Procedures and verification testing in a permanent abandonment are more rigorous than in temporary abandonment.
Factors
P&A operations are one of the more variable portions of decommissioning because the operation is influenced by numerous variables and events and, as in most other offshore activities, tend to depend on factors that cannot be predicted.
Some factors that influence the time and cost to plug and abandon a well include the contract type, site location, job specification, water depth, and such exogenous events as weather and problem wells. Such factors as wellbore complexity, job preparation, and contractor experience are also important variables but are generally considered unobservable.
• Contract type. P&A contracts are written on a day-rate or turnkey basis and both are popular in the Gulf of Mexico.
Under a day-rate contract, the service company performs activities for a fixed fee per day worked under the supervision of the operator. The contract specifies the responsibilities of each party.
The contractor is normally responsible for service equipment, a fully staffed crew, and specified materials and supplies. The operator of the well will usually retain ownership of the wellhead and all recovered tubulars (casing, tubing) and be responsible for disposal of all fluids circulated from the wellbore and any other waste generated on location.
Under a turnkey contract, the service company is paid a fixed fee (“lump sum”) in return for completing the job according to contract specification. Turnkey contracts offer contractors incentives to finish a job in a timely manner because the contractor retains the cost savings of early completion.
Unless the job requirements are well known and predictable, turnkey contracts also expose the contractor to additional risk in the form of capital, environmental, and technical risk. Because of the additional exposure, uncertainty, and potential cost overruns, turnkey contracts are priced at a premium relative to day-rate contracts. Risk premiums vary with market conditions and the experience of the contractor, job specification, and other, mostly unobservable, factors.
• Job type. Jobs are classified as permanent or temporary abandonment operations. The number of sites per job and wells per site determines the total work requirement. A site may have more than one well to plug and abandon; if the job specification involves several sites, economies of scale may result because mobilization and demobilization time would be reduced and the contractor is already “primed” for work.
In the gulf, P&A contracts are frequently written on a site-by-site basis, making the resulting economies from reduced mobilization and demobilization minor. Jobs performed on a multiple well package may lead to economies from learning, discounts offered by the service provider, or a combination of these factors.
• Well complexity. Complex wells arise from diverse factors, including the nature of the geologic formation, depth of the target, size of the reservoir sands, trajectory of the wellbore, and technology applied. Well complexity is difficult to quantify and frequently ambiguous because downhole conditions are often unobservable and practices, opinions, and experiences among contractors vary so dramatically.
Typically, a complex well will have high deviations at the surface casing shoe, severe doglegs, or be extended reach. Liner, tubing strings with gas-lift mandrels, submersible pumps, and packers can also create problems. Other difficulties may include sustained casing pressure, hydrogen sulfide, parted casing, or milling work. Junk found in holes, or equipment which cannot be retrieved, can increase cost significantly.
• Location. The location of the job determines mobilization time to the site.
For most infrastructure in the gulf, it usually takes a day at most to arrive on location and prepare for service. Costs for most operations in the gulf are, therefore, not strongly influenced by distance to shore. The distinction between near-shore and far-offshore can be significant, however, because the uncertainty associated with offshore operations is generally larger and of greater significance the farther offshore the activity occurs.
• Water depth. Water depth is often a primary variable in offshore construction and drilling activities because water depth determines the size and technical specifications of the service vessel and rig.
In water depths 400 ft (120 m) or shallower, depth is not expected to be a significant factor because this category is relatively homogeneous in type of rig required. For deepwater wells, water depth will likely play a greater role in the cost of the operation.
• Age. The equipment and components of a well will deteriorate over time from corrosion, wear, and normal operating conditions that may affect the ability of the work crew to perform P&A functions. In old wells, it is not uncommon to find downhole obstructions in the production tubing, leaks, and corrosion.
Not all components of a well have the same age, however, and therefore age comparisons need to be made with caution. A well completed 25 years ago, for example, could have a new tubing string installed from a recent workover. Without detailed knowledge of the maintenance history of each well, such information remains inaccessible, and age may be an unreliable indicator.
• Preparation. The availability of good records is essential to planning and execution. If good records are unavailable or do not match the well configuration, planning success may be affected.
In old wells, records may not exist and, if they do, often provide incomplete or inaccurate data to indicate downhole conditions. The long time between well completion and P&A means that operations are often performed after the value of the reservoir is exhausted. Ideally, operators should develop an abandonment plan before the well is drilled, which should be updated each time the well’s mechanical configuration is changed.
• Problem wells. Problems may arise in P&A activities that delay the operation. When an obstruction prevents pumping, wireline typically recovers the obstruction or moves it to a point where pumping can be conducted.
Differences in fluid densities of the cement plug and wellbore fluids can contribute to plug failures, and inconsistencies may cause the cement to move down through the well fluid and become contaminated. Instability is also influenced by wellbore angle, workstring or hole diameter, and wellbore-fluid geologies.
Such unexpected configurations or wellbore conditions as holes in casing can also slow the abandonment operation and contribute to cost overruns.
• Fluid type, severity. Wells with sour fluids will have accelerated corrosion rates and stress cracking that, depending on the age and wellbore construction, may impair a company’s ability to perform P&A functions. Components that feature corrosion-resistant alloys can mitigate the effects of sour fluids to some extent.
• Well access. In normal operations, P&A activity takes place from a platform or workboat, and procedures and tools are designed for vertical access. For structures destroyed in a hurricane, the wellbores lie horizontally on the seabed, requiring special equipment and procedures.
The loss of a platform can be compensated by the use of a lift boat or mobile drilling unit. To allow vertical access to wellbores, divers must cut conductors. Diver cuts are significantly more hazardous and expensive than mechanical cutting, and limited access and poor visibility often slow progress and expose personnel to more risk than normal conditions.
• Technology. Application and use of advanced technology vary with service provider and job specification. Tradeoffs exist between the cost-saving potential associated with new technology vs. the start-up cost of learning; e.g., multi-function fishing techniques can reduce the number of trips required to cut and recover casing and the wellhead assembly in deepwater operations but are also more expensive and difficult to apply. The impact of technology and advanced diagnostic tools on specific operations is usually difficult to quantify.
• Construction practices. Well-construction practices used in drilling and completions and decisions the operator makes during the well’s production life can affect P&A requirements. If annuli are properly isolated with no uncontaminated cement during completion and if the well is kept in good mechanical condition with regular workovers, abandonment is usually relatively straightforward to perform.
• Rig vs. “rigless” method. P&A operations can be performed with either rig or rigless methods. The method chosen is dictated by engineering requirements, contractor preference, and equipment availability. Both methods are popular in the Gulf of Mexico.
The traditional approach involves using a rig with a derrick, drawworks, and surface equipment, and precedes much like a normal workover. A liftboat may be moved to the job site or platform equipment may be available. Most subsea wellheads require a rig-based method.
In the rigless approach, a crane pulls pipe, and coiled tubing and wireline units assist with the placement of cement plugs. Coiled-tubing units can enter and exit wells faster and are normally less expensive than the rig method.
• Exogenous conditions. Weather conditions, mechanical problems, and logistics can significantly affect the scope of offshore operations and in most instances are unpredictable. Weather is a factor in all offshore operations and weather extremes reduce labor productivity and increase downtime. Mechanical problems and logistics can be mitigated to some extent through preparation and proper contingency planning.
Descriptive statistics
The database for analysis was compiled from jobs performed by Tetra Applied Technologies in the gulf 2002-07. The sample set consisted of 256 jobs and 1,156 wells performed across a wide cross-section of operators, representing 15-50% of all wellbores plugged annually. At the time of the analysis, the sample set for 2007 was incomplete; conclusions based on the 2007 data are therefore not definitive.
Cost and operational data were collected by review of invoice and job reports for all offshore operations performed by Tetra Applied Technologies. Job reports describe the day-to-day (actually, hour-to-hour) operations and include information on contract type, operational activities, and use of liftboats and workboats.
Water depth was available for only a portion of the sample, and job type was described for fewer than half the wells. Contract type was specified. Jobs mainly involved platform wells, and although several wells were performed with rigless techniques, most the jobs used rigs. All of the jobs were in water depth less than 400 ft on dry trees. No subsea wellheads were abandoned.
For turnkey contracts, we employed the total cost of the operation rather than the revenue received (the contract bid). The majority of the sample set represented standalone P&A jobs, but we also included a dozen or so jobs performed as part of a total decommissioning operation in which the P&A cost data were clearly delineated. Costs are reported as current (nominal) dollars and are not adjusted for inflation.
An accompanying box describes variable notation.
• Contract cost. In 2002-07, day-rate contracts consisted of 116 jobs and 300 wellbores, and turnkey contracts 140 jobs and 856 wellbores. Contract type is an important determinant of the cost of the operation. The average P&A cost for a day-rate contract was significantly smaller than the average turnkey cost, ranging anywhere from 50-65% less expensive (Table 1). In 2006-07, a dramatic reversal occurred, with average day-rate contracts exceeding the turnkey variety by four times in 2006 and almost double in 2007 (Table 2).
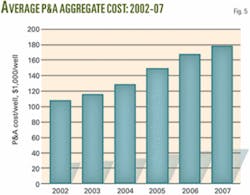
A composite average P&A cost that aggregates day-rate and turnkey contracts exhibits more regularity over time because it averages across all jobs (Fig. 5). Fig. 6 shows the annual increase in the composite P&A cost: In 2002-07, the increase in the composite average P&A cost was 11.3%/year.
A structural shift in cost appears between 2002-05 and 2006-07. This change in cost is due to the influence of three factors: scale economies, the level of competition for services in the aftermath of the 2005 hurricanes, and job type performed.
Turnkey contracts averaged 3.4 wells/job in 2002, 4.3 wells/job in 2003, 4.7 wells/job in 2004, and 5.9 wells/job in 2005. During this same period, between 1.2-2.5 wells/job were plugged under day-rate contracts.
In 2006, because of devastation from Hurricanes Katrina and Rita, damaged structures required more wells to be abandoned. It appears that turnkey operations were a favored contract for this activity. Well owners preferentially select turnkey contracts for large well inventories, old wells, or complex operations.
The total number of jobs did not increase significantly from previous years, but the number of wells per job increased substantially (averaging 15.6 wells/job). Scale effects appear to be important when five or more wells/job are plugged.
Cost increases observed in 2006-07 are also due to the high level of competition for services. After the 2005 storms, competition for labor, equipment, and vessels in the gulf rose dramatically, increasing vessel day rates two or three times historic levels. The same competitive pressures hitting day-rate contracts also affect turnkey jobs, but scale economies for turnkey jobs appear to serve as a moderating lever.
The third factor contributing to cost differences between contract types is related to the type of job performed, whether the operation was a temporary abandonment or a permanent abandonment.
Temporary abandonment is easier and cheaper to perform than permanent abandonment, and a significant number of P&A operations performed in 2006 were temporary abandonments. Those jobs performed under a turnkey contract will accentuate cost differences and contribute to a lower relative value, for all other things equal.
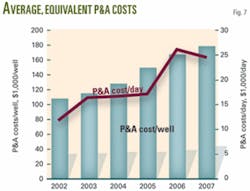
• Daily cost. Fig. 7 shows the average cost to plug and abandon a well expressed on an equivalent day-rate basis. The two numerical values are closely, but not perfectly correlated, across time. In 2002-05, the average cost to perform P&A activity ranged from $5,600-13,000/day for day-rate contracts, $15,800-22,300/day for turnkey contracts, and $11,800-17,200/day for the composite category (Table 1).
In 2006, the average cost increased significantly across both contract types, to $28,000/day for day-rate contracts and $23,200/day for turnkey contracts (Table 2). The composite category averaged $26,100/day in 2006.
High day rates have continued into the 2007 season, reflecting the continued strong demand for labor and service vessels in the gulf, but shows signs of returning to more moderate prehurricane levels. Steady, moderate inflationary pressures on daily cost in 2002-05 appeared, while the hurricane destruction and its impact on the service market made 2006 exceptional. Moderation in the daily rates is evident in 2007 and is likely to continue in the future in the absence of destructive weather events.
• Average number of days. The number of days to plug and abandon a well has been relatively stable over the past 5 years, averaging about 10 days/well, except in 2006, when many wells were plugged under turnkey contracts at an average of 2.4 days/well (Table 1). That many of the wells plugged in 2006 were temporary abandonments at least partially explains the favorable performance.
• Composite statistics. The average cost to plug and abandon a well under a turnkey contract over 2002-07 is slightly greater than under a day-rate contract, but as we have previously shown the composite statisticsbecause of the aggregation processmask important trends that have occurred over the past 5 years.
The 5-year average cost to plug and abandon wells is $17,900/day, and it takes about 9 days/well to perform the operation (Table 3). Turnkey contracts that Tetra writes serve about twice as many wells than day-rate contracts (6.1 vs. 2.6 wells/job).
• Total cost. The total cost of P&A operations depends on several observable and unobservable factors. Methods to predict the total cost of a job based on a subset of recorded variables are subject to significant limitations and are only reliable “on average” when a large number of jobs are considered.
One of the simplest ways to forecast the cost of a P&A operation is to correlate the total cost of the activity with the number of wells per job. If one could accurately estimate the number of days to perform the operation, this additional information would improve the forecast if the conjecture were accurate. Because the number of days to perform the activity is unknown and uncertain, however, we run the risk of introducing additional uncertainty into the problem.
Tables 4 and 5 depict regression models for total cost, using the number of wells per job and the number of days as the descriptive variables. We estimate the model with and without a fixed-term coefficient and aggregate the data according to contract type. The correlations are based upon the complete data set with no inflation adjustments. The output statistic is measured in terms of $1,000. (An accompanying box presents cost relations.)
Both factors are highly significant, as expected, and as number of days is incorporated in the model, the model fits improve substantially. Models without a fixed term are also more robust in all the formulations.
Scale economies
Scale economies may arise from technical efficiency arising from the size of the job and from discounts contractors offer on multiple well packages.
P&A jobs are usually performed at one site. In some cases, contracts may be let on a field or area-wide basis. As the number of wells per job increases, unit costs typically decline. If learning effects are present for multiple well operations, the contractor may become more efficient, and this should be reflected in the cost trends.
Another reason scale economies may be observed in P&A activity has to do with discounts that contractors offer operators on multiple well packages. In this case, the discount offered by the contractor to acquire the job, rather than any inherent learning, would be responsible for the cost reduction. The job data were analyzed by contract type according to the number of wells per job, for 1 well job, 2-4, 5-10, 11-15, and more than 15 well jobs. (Table 6).
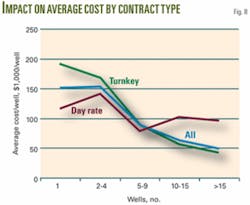
For day-rate contracts, the average cost per well exhibits no well-defined trend, but we observe that the average cost per well for jobs with 1-4 wells is somewhat greater than the larger well-count categories.
For turnkey contracts, the results exhibit a clearer trend. As the number of wells per job increases in turnkey contracts, the average cost per well decreases significantly. The average cost per well for jobs with less than 5 wells is $177,000/well. For jobs with 5-10 wells/job, the average cost decreases to $90,000/well, a 50% decrease in unit cost from the 1-4 well job category.
As the number of wells per job increases further, the unit cost continues to decrease, from $58,000/well (11-15 wells) to $44,000/well (more than 15 wells).
(A final box presents the limits of this analysis.)
References
- Kaiser, M.J., and Dodson, R. “Cost of Plug and Abandonment Operations in the Gulf of Mexico,” Marine Technology Society Journal, Vol. 41, No. 2: 12-22.
- Bull, E. Environmental Guidance Document: Well Abandonment and Inactive Well Practices for U.S. Exploration and Production Operations. Washington: API, 1993.
- Smith, D.K., Handbook of Well Plugging and Abandonment. Tulsa: PennWell Books, 1993.
- Oil and Gas and Sulphur Operations in the Outer Continental ShelfDecommissioning Activities; Final Rule. 2002. US Federal Register 67 (96), 35398-35412, Department of Interior, Minerals Management Service, 30 CFR Parts 250, 256.
- Nichol, J.R., and Kaiyawasam, S.N., “Risk assessment of temporarily abandoned or shut-in wells,” C-FER Technologies, 2000, Department of Interior, Minerals Management Service.
The authors
Mark J. Kaiser ([email protected]) is research professor and director, research and development at the Center for Energy Studies, Louisiana State University, Baton Rouge. His primary research interests are policy issues, modeling, and econometric studies in the energy industry. Before joining LSU in 2001, he held appointments at Auburn University, the American University of Armenia, and Wichita State University. He holds a PhD in industrial engineering and operations research from Purdue University.
Richard D. Dodson ([email protected]) is vice-president of Tetra Applied Technologies Inc., a wholly owned subsidiary of Tetra Technologies Inc. He was the founder and president of Pacer-Atlas Inc., which was acquired by Tetra, and the founder and president of Sunstone Corp. From 1971-75, he was a commissioned officer in the US Marine Corp and attended Abilene Christian University. He has been a member of several company boards, including Southfork Energy, Soncett Energy, Integrated Crude, and Rebel Well Service. Dodson is a member of AESC, API, NPRA, and SPE.
Variable notations
Plug and abandonment jobs are classified according to day rate (DR) and turnkey (TK) contract type and in a category that aggregates both contract types (ALL).
The data are described by average cost per well, Avg_cost_well (Acw); average cost per day, Avg_cost_day (Acd); and average days per well, Avg_days_well (Adw).
The standard deviations of Avg_cost_well, Avg_cost_day, and Avg_days_well are denoted as SD_Acw, SD_Acd, and SD_Adw. The number of jobs and number of wells per category are denoted as Number_jobs and Number_wells. The ratio Number_wells/Number_jobs indicates the average number of wells serviced per job.
Cost relations
In Table 4, total cost is correlated with the number of wells (NW) per job:
- Day-rate contracts: Total_cost = 102.6 NW
- Turnkey contracts : Total_cost = 65.7 NW
- All contracts: Total_cost = 69.3 NW
In Table 5, total cost is correlated against the number of wells per job and the number of days (ND) to perform the service:
- Day-rate contracts: Total_cost = 5.5 ND + 56.8 NW
- Turnkey contracts : Total_cost = 18.4 ND + 9.6 NW
- All contracts: Total_cost = 12.6 ND + 24.4 NW
Limitations of analysis
The P&A job data consist of a large and diverse sample, but because the data are from a single contractor, the analysis may not be representative of the industry as a whole. We believe the benefits of using a consistent and homogeneous data set outweigh the drawbacks from potential contractor bias.
All the jobs were performed on dry-trees in water less than 400 ft deep. Because deepwater wells and subsea wells are more complex to plug and abandon and in some cases significantly more complex, extrapolation of the summary statistics outside this categorization is not valid.
The reported data did not allow us to differentiate between the type of operation performed under turnkey and day-rate contracts. In normal years, turnkey contracts are often used on complex wellbores or uncertain operations. During the aftermath of the 2005 hurricane season, turnkey contracts were the preferred mechanism to help operators reduce their financial exposure and operational risk associated with cleanup operations.
Job requirements for temporary abandonment are not as rigorous as permanent abandonment. For all things equal, therefore, the average cost of a typical temporary abandonment would be expected to be less than a normal permanent abandonment. Unfortunately, the two operations cannot be distinguished from the data entries; we therefore cannot distinguish the impact of this factor on the cost data.
It would be desirable to correlate P&A costs with the characteristics of the wellbore, job and contract type, and the technical aspects of the operation, but such a correspondence is difficult to realize in practice due to the complexity and uncertainty of the operation and lack of reliable data. Even if downhole conditions could be modeled accurately, the degree of uncertainty due to topside factors can only be reduced, not eliminated. P&A cost estimation, like most other aspects of decommissioning operations, will always exhibit a high degree of uncertainty.
