Proper solids control is essential for optimum drilling fluid performance. This article presents a new technique to test shaker screens, complementary to API RP 13C.
The evolution of high-performance linear and elliptical motion vibratory shakers has culminated in shaker screens often being the only separation device employed on a drillsite. Designating and labelling screens has been historically controversial; screen labels do not always correctly define the separation potential of a particular mesh. In 1993, the American Petroleum Institute (API) issued Recommended Practice (RP) 13E for the drilling industry; it was a significant step forward in identifying screens with distributed aperture sizes.1
The last 10 years have seen the introduction of multilayer screens, screens with rectangular openings, and screens with wave-formed surfaces. Although these new screens offered improved conductance and blinding resistance, they also introduce complexities in determining the screens’ separation capabilities.
For instance, a laboratory test sieve is made of a single-layer screen cloth. The openings are quadratic in shape and the cut size is marked onto the sieve, followed by a certification process. With screens used on a shale shaker, however, there are several different types of screen cloth, which may not have quadratic openings. It is not uncommon to find screens with oblong openings.
In multilayered screens, several layers of screen cloth, having different mesh sizes, are glued together. In this case, the mesh sizes no longer determine their separation capabilities.
Screens with different types of surface and openings are used in shale shakers. People tend to use a standard image analysis technique, as earlier recommended by API, for arriving at some numbers representing the separation capability of such screens. The experience of Norwegian operators Statoil ASA and Norsk Hydro AS (now StatoilHydro ASA), however, showed that this method of screen designation, using the image analysis technique, was inadequate for correctly defining separation capacity of complex screen configurations. There was a need to develop a standardized test procedure acceptable to both organizations.
Screen performance relies on several other properties, including screen conductance or flow capacity, dependent on the extensional viscosity of the drilling fluids. Shaker motion is another issue. Total blinded area will affect the flow capacity. Screen wear affects the life of the properties. Some screens vary in their separation performance because wires move during use, even though no obvious holes are generated in the screen. None of these extraneous effects is taken into consideration in the present study, however. Our focus is on the original separation performance of the screens, measured in realistic model drilling fluids.
Current drilling operations in depleted reservoirs often add particles to enhance formation strength.2 In such cases, it is important to know the particle size distribution of the coarser particles in the drilling fluid. This makes it necessary to measure both the cut point and separation characteristics of the screens. The method outlined in this article was developed while keeping in mind the approach of API RP-13C and the needs of the oil companies that supported this development work.3 This procedure is seen as complementary to the API procedure and will improve understanding of the screen performance.
Tests following API RP-13C are conducted by sieving the selected particles in air. Flow through a screen is predominantly extensional. Therefore, evaluating screening of particles for formation strengthening requires using a base fluid that has both a viscosity and an extensional viscosity that are realistic for drilling fluids.4
There is a strong connection between shaker motion and fluid viscosity. We selected a fluid that does not change properties with vibration5 and should give a coarser and less sharp cut point than tests in air would provide. The coarser cut point will be more realistic than a cut point measured in air.
While we acknowledge that the present API RP-13C gives valuable information, as did the earlier recommended practices, it does not give all the relevant information necessary for oil well drilling operations. The new test procedure gives the industry some additional necessary information. This article describes the procedure and thoughts behind the test development and discusses the results obtained and the challenges researchers still face.
Test procedure
Although it is common to use alumina or glass balls as the solid medium for screen testing, this new procedure used sands of various size ranges for different screen separation ranges. In order to simulate the operating conditions, we used a blend of xanthan gum with water as the testing medium. The concentration of xanthan gum used yielded the power law viscosity parameter, K = 1.65 mPasn, and the power law index, n(exponent) = 0.26.
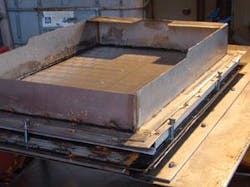
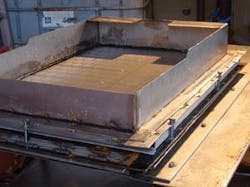
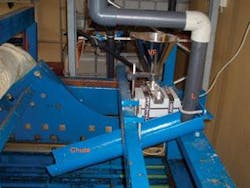
We modified a Derrick Shaker FLC 2000 for the test procedure. The test screens were mounted in a frame (Fig. 1). The whole fixture is mounted on the shaker machine. Fig. 2 shows the liquid and solids feeding mechanisms. The particles are fed through a vibratory feeder, VF, at a controlled rate. The drilling fluid is pumped through the pipe, L, and discharged at the same point on the chute at which the particles get mixed with the liquid and travels on the screen surface.
A known amount of solid was added to the fluid before it passed through the screens. The solids remaining on top of the screens and the solids passing through the screens were collected and measured to check the mass balance. During the procedure development stage, several tests confirmed that collecting solids only from the top surface of the screen was sufficient to provide an accurate prediction of the screen’s cut point.
Measuring particle distribution
Use of standard laboratory classification screens for analysis of particle size distributions would be optimum for such an operation. However, for particle sizes smaller than 70-80 μm, the use of such screens is difficult because the fine particles will adhere to the screens and lead to erroneous test results.
To avoid such errors, we used laser diffraction spectrometry. In order to generate compatible results for the whole range of screens, we chose to use laser diffraction spectrometry for the entire range of particle sizes, using a HELOS laser (helium-neon laser for optical spectrometry, manufactured by Sympatec GMBH, Clausthal-Zellerfeld, Germany.). HELOS measures the diffraction pattern caused by particles in the path of the laser beam.
Particle sizes were measured in dry conditions with a dry dispersion unit. This uses an ejector effect to blow dry powder across the path of the laser beam and then to a vacuum cleaner. We used a lens with a measuring range of 0.5-875 μm.
Test sands, cut points
We used Millisil and Baskarp quartz sands to simulate cuttings, delivered by Sibelco Scandinavia. A 50/50 wt % of Millisil and Baskarp 10 is used for sieve openings smaller than 100 μm. For openings larger than 100 μm, Baskarp 10, Baskarp 15, Baskarp 20, and Baskarp 35 are used.
A cut point curve graphically displays the fraction of various size particles removed by the solids control equipment compared to the quantity of that size particle presented to the equipment. For example, a D50 cut point is the intersection of the 50% data point on the Y-axis and the corresponding micron size on the X-axis on the cut point graph.6 This cut point indicates the size of the particle in the feed to the solids control equipment that will have a 50% chance of passing through the equipment and 50% chance of being retained by the screens.
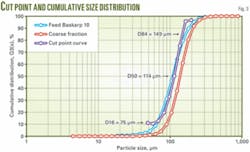
The values reported are D50, D16, and D84. The values of D16 and D84 are selected because they are one standard deviation from a gaussian distribution mean. Fig. 3 shows the cut point curve and the cut point values, as well as the particle size distribution of the test sand (feed Baskarp 10) and the discard sand (coarse fraction).
Robinson and Morgan presented the results of the work committee establishing new API procedures on shaker screen designations.7 The new API procedure uses the D100 values for aluminium oxide particles in air as screen designations. These values define a new type of cut point that is adequate for most drilling operations. Previously, shaker screens were designated by mesh number. Screen opening and mesh number is not uniquely defined, even for single cloth screens, as shown by Dahl et al.8 Therefore, we follow one of the conclusions stated by Robinson and Morgan: Mesh number should not be used to designate screens.7
If particles are added for formation strengthening,9 it is necessary to know both the cut point and the particle separation skewness. The skewness is defined as S = D84/D16, where these values are measured values and not values determined by image analysis or any other theoretical evaluation.
Since the D100 value does not reveal a practical limit for the content of large particles, a measured D50 value is more usable for screen selection if formation strengthening is the main focus. This is because it is no longer sufficient to know the maximum particle size in the fluid equal to the D100 cut point value. What is needed is information about the particles that are separated from the fluid and the particle-size distribution of the particles following the fluid through the shaker. It is the particle-size distribution that can prominently affect the formation and prevent further growth of fractures.
Test procedure
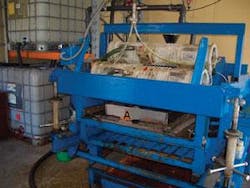
The shale shaker used for the tests is a Derrick shaker FLC 2000, modified to suit test requirements (Fig. 4). The screen’s deck is mounted on the fixture as shown in Fig. 1, and this fixture is also identified as ”A” in Fig. 4.
Real separation cut points (efficiencies) have been measured with predefined solids representing cuttings both larger and smaller than 100 μm. The test procedure is as follows:
- Mount the screen deck on the fixture.
- Attach the fixture and screen deck on the shale shaker.
- Prepare the fluid and test viscosity; add xanthan gum to reach desired viscosity.
- Start the shale shaker.
- Start the slurry pump; pass fluid through screen for about 2 min, taking care to ensure that the fluid bed and layer are covering about 66% of the screen area and length).
- Immediately after this, feed prepared sand from a vibration feeder above a half pipe, where the mixing takes place, while the pump keeps running. Continue feeding sand for about 3 min. Fig. 2 shows the feeding arrangement.
- After the sand feeding is over, continue pumping for about 2-3 min.
- Stop the pump and the shale shaker.
- Remove particles from the top of the screen; wash with water to collect the sand sticking to the screen. Collect washed sand and water.
- Dry particle slurry in a furnace.
- Weigh solid dry particles.
- Analyze size of solid particles to find out the separation efficiency of the screen.
This procedure is a tool to assess relative performance of different screens under simulated test conditions.
Test results
During the past year, we tested several screens with various screen cloth openings and specifications, from various suppliers. We now provide the test results for presumably similar size screens, as measured or predicted by eight different screen manufacturers. We have presented them in random order in the figures in order to protect commercial interests. The test results show that the screen sizes claimed by the manufacturers often do not give same results when tested under controlled conditions.
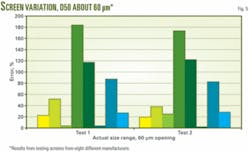
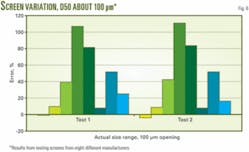
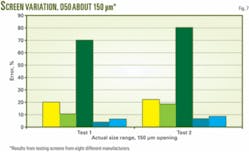
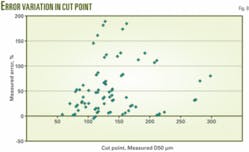
The claimed sizes of the screen openings tested were mostly in three size ranges-about 60 μm, 100 μm, and 150 μm. Fig. 5 shows the variation of percent error in measurement as compared to the value stated by the suppliers for the screens that had a D50 value of about 60 μm. Figs. 6 and 7 show the comparative performance of screens having D50 value of 100 μm and 150 μm, respectively.
It is evident that in the case of some manufactured screens, the percent error for 60-μm range is as high as 180%, while for 100 μm, this error was about 100%. For screen openings marked 150 μm, the maximum error was around 75%, while for most suppliers the error was below 20%. In case of 100 μm and 60 μm openings, an error value of 20% or less is an exception. Most screens had larger error values.
All the data from all the tests are plotted on Fig. 8, which shows the variation of percent error with respect to the measured D50 values. The measured cut point values are used to maintain anonymity of the screen suppliers. The figure clearly shows that in general, the percent error increases as the D50 values decreases. For screens claimed to be coarser than 150 μm, the error is relatively smaller.
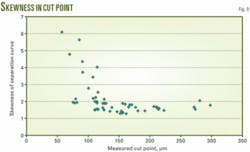
There is more information from the tests than the cut point. A skewness value can be calculated as S = D84/D16. For an ideal screening process the skewness value approaches unity from the above relationship. In other applications, a positive known skewness may be beneficial if the fluid is going to be used for formation strengthening.
In Fig. 9, the skewness values of all the tests are shown as function of the measured D50 value. The sharpest cut is obtained for a screen with a D50 cut point equal to 162 μm. Here, the D84 value is only 26% larger than the D16 value, indicating a well-defined cut point. According to the manufacturer’s analysis, however, this cut point should be slightly less than 60 μm.
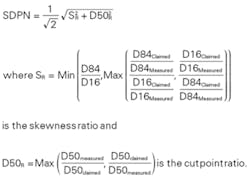
In order to be able to account for such discrepancies, there is a need for a statistical parameter that can address both the skewness and the deviation from the expected cut point. We call this parameter the screen delivery performance number (SDPN) and define it as the length in a vector space, with the first vector being the skewness value as defined above and the second vector being the measured cut point divided by the claimed cut point by the producer.
Thus, the SDPN value is defined as:
The skewness ratio is the maximum ratio between the claimed skewness and the skewness measured by the present method. In the absence of any claimed skewness values, the calculated skewness will be used.
The cut point ratio is the maximum ratio between claimed and measured cut point, defined such that any difference will give a value larger than unity, independent of whether the measured cut point is greater or smaller than the claimed cut point.
In the case of an ideal screen, the value of the skewness ratio will be one and the value of the cut point ratio will be one, hence the ideal value of SDPN = 1. In actual use, any screen with a SDPN value higher than but close to unity will be considered as a good screen.
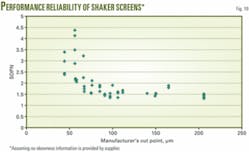
Fig. 10 presents the variation of SDPN values of the tested screens with respect to the measured cut point values. Since this is a statistical analysis we have assumed that no skewness information is known from the suppliers on any of the screens. However, several screen providers release skewness data. We do not use these in this statistical analysis in order to present a theoretical worst-case scenario. We have used only the measured cut point values.
Since it is more difficult to produce finer screens, the SDPN values are better for larger screen openings (Fig. 10). Statistically, we found that the SDPN value of screens with claimed cut points slightly less than 100 μm is less than 2, indicating that the performance of these larger screens should be acceptable. For the finer screens, however, the SDPN values are much larger and, hence, care needs to be taken to select the correct and most suitable screen for a given operation.
Results
The results from this study confirm the conclusion by Robinson and Morgan that cut point determined by using image analysis will not give adequate information about shaker screen separation performance.7 For finer screens with D50 values of 100 μm or less, one should expect much larger values of D50 than claimed.
A skewness value defined as D84/D16 is necessary to describe the separation performance properly. Although some shaker screens demonstrated a claimed cut point being close to the measured, these screens had large skewness that was not documented by the supplier. Such unknown large skewness would, in practice, allow an unpredictably large volume of coarser material than the cut point through the screen, which is highly undesirable.
We introduced a statistical parameter that combines the effect of claimed vs. measured cut point and the skewness. This parameter illustrates the total screen performance in a single number, SDPN. In general, statistically it was found that most screens with a larger cut point than 100 μm, the SDPN had an acceptable value. For finer screens there was a significant scatter in this value.
Acknowledgment
The authors thank the following individuals and companies for their close cooperation in carrying out the tests and development of the test procedure and also for allowing us to publish the findings of the study: F. General at Haver & Boecker, Oelde, Germany; N. Hilbig at MI Swaco, Stavanger; E.M. Knudsen at Scan Tech AS, Stavanger; T. Larsen at Halliburton AS, Tananger; D. Mecca at Derrick Corp., Buffalo, NY; R. Minton at Axiom Process Ltd., Aberdeen; R. Runestad at National Oilwell Varco, Tananger; T. Storevik at Baker Hughes Norge AS, Tananger.
References
- API Recommended Practice 13E, Third Ed., American Petroleum Institute, Washington, DC, May 1993.
- Asston, M.S., Alberty, M.W., Mclean, M.R., de Jong, H.J., Armagost, K., “Drilling Fluids For Wellbore Strengthening,” SPE 87130, SPE/IADC Drilling Conf., Dallas, Mar. 2-4, 2004.
- API Recommended Practice 13C, Third Ed., American Petroleum Institute, Washington, DC, December 2004.
- Barnes, H.A., Hutton, J.F., and Walters, K., An Introduction to Rheology, Rheology Series 3, Elsevier, 1989.
- Fard, A.R., Omland, T.H., and Saasen, A., “Shale Shaker’s Effect on Drilling Fluids Rheological Properties,” Ann. Trans. Nordic Rheology Soc., Vol. 15 (2007), pp. 227-230.
- Cutt, A.R., “Shaker Screen Characterization Through Image Analysis,” SPE 22570, 66th Ann. Tech. Conf. and Exhibition, Dallas, Oct. 6-9, 1991.
- Robinson, L., and Morgan, M., “The 2004 Solids Control API RP 13C,” paper AADE-05-NTCE-75, AADE National Technical Conf. and Exhibition, Houston, Apr. 5-7, 2005.
- Dahl, B., Saasen, A., and Omland, T.H., “Successful Drilling of Oil and Gas Wells by Optimal Drilling Fluids Solids Control-A Practical and Theoretical Evaluation,” SPE 103934, IADC/SPE Asia Pacific Drilling Technology Conf. and Exhibition, Bangkok, Nov. 13-15, 2006.
- Omland, T.H., Dahl, B., Saasen, A., Taugbøl, K., Zwaag, C.V.D., and Amundsen, P.A., “Optimisation of Solids Control Opens Up Opportunities for Drilling of Depleted Reservoirs,” SPE 110544, SPE Asia Pacific Oil & Gas Conf. and Exhibition, Jakarta, Oct. 30-Nov. 1, 2007.
The authors
Biplab Kumar Datta ([email protected]) is currently head of the department of POSTEC, Tel-Tek, Porsgrunn, Norway, and is also professor of powder technology at the University College of Telemark, Porsgrunn. He has served as assistant professor at Indian School of Mines, India, for about 12 years, and worked in other industries. Datta holds a PhD in engineering from Jadavpur University, India. He is a member of Norwegian Institute of Engineers and the International Freight Pipeline Society.
Arild Saasen ([email protected]) is a specialist in fluid technology at StatoilHydro ASA in Stavanger and professor at the department of petroleum engineering, University of Stavanger. He was affiliated with Statoil before the merger and previously worked at Rogaland Research and the University of Stavanger. He holds a degree in fluid mechanics from the University of Oslo and PhD in rheology from the Technical University of Denmark, Lyngby.
Franz Otto von Hafenbrädl ([email protected]) is department engineer at Telemark Technological R&D Centre, Porsgrunn, Norway. He holds an MSc from the University College of Telemark, Porsgrunn.
Per Ove Haugen ([email protected]) is currently head of drilling at StatoilHydro, Sandsli, Bergen, Norway. He was affiliated with Hydro Oil & Energy before the merger. He has also served in various positions within various drilling companies, including 12 years in leading positions. Haugen holds a degree in mechanical engineering from Bergen Technical University.
Tor H. Omland ([email protected]) is a senior drilling engineer in StatoilHydro ASA in Stavanger. He was affiliated with Statoil before the merger and has been working with drilling and completion fluid for the past 10 years. Omland holds an MSc in petroleum technology from the University of Stavanger.
