Model increases liquids lines’ exhaust efficiency
A new model has increased the efficiency and safety of air-exhaust procedures in the commissioning of liquids pipelines in hilly terrain.
Air accumulated in a pipeline during commissioning can damage it and make interface tracking in batch transportation difficult, requiring the air’s efficient discharge. Such accumulation frequently occurs in long-slope pipe segments in hilly terrain, increasing the importance of determining the size and location of any air pockets in these settings.
In traditional commissioning procedures, determining the location of the air mass and the time of its exhaust relied on the use of pressure devices: If air intake occurred, the entire transport line would shutdown and exhaust the air at the pipeline’s peaks. This method of air exhaust was passive and time consuming and led to greater quantities of contaminated product.
This article applies both fluid mechanics theory and multiphase flow theory to analyze the formation and movement of intake air encountered during commissioning of the China West Products Pipeline. It presents equations for calculating the location and length of intake air in the pipeline in an effort to provide theoretical support for accurately determining air exhaust in the commissioning of future hilly terrain pipelines.
The resulting model allows air mass pressure, length, and location to be calculated under normal transportation conditions for other pipelines. The calculation results show a certain distance between where air stagnates and the pipeline’s next peak. Using the model in practical applications can move the air to the predesigned air exhaust points by regulating liquid flow rate and pressure.
CWPP commissioning
The number of pipelines in China has increased rapidly in recent years. These pipelines are typically large diameter, high pressure, and high throughput, with the majority built in hilly areas. CWPP is one of the longest and most complex.
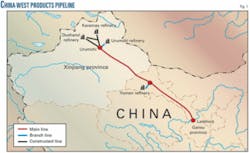
CWPP consists of both the China West Products Pipeline and China West Crude Oil Pipeline, constructed in one ditch. The main line runs from Urumchi, Xinjiang province in western China, to Lanzhou, Gansu province in central China, passing through two provinces and 21 cities (Fig. 1). CWPP is 1,858 km long, with six distribution stations and 50 cutoff valves. Its designed throughput is 10 million tonnes/year of gasoline and diesel.
CWPP’s commissioning differed from previous pipeline start-ups in China. Operators usually first fill the pipeline entirely with water, with all pressure devices, valves, pumps, and other transport equipment then adjusted. When everything works well, the operator then fills the pipe with oil products, displacing the water. This method allows full preparation of the pipeline and the air exhaust process is safe because it is evacuated with the water. The procedure, however, is time-consuming and requires large quantities of nearby water.
Western China, especially Xinjiang and Gansu provinces, suffers from a serious water shortage. CWPP therefore used a different commissioning technique, filling only part of the pipeline (about 650 km) with water and then pumping oil products into the pipeline to displace the water. CWPP’s long slope characteristics, however, led to air exhaust problems as a result of this process.
Pipeline air exhaust in China usually occurs as static pipeline air exhaust. Before performing the air exhaust procedure the whole pipeline is shutdown so that the air in the pipe can accumulate at the relatively high points in pipeline. Frequent shutdowns of the CWPP, however, could cause the oil portion of the linefill to mix rapidly with the air, making subsequent air exhaust dangerous. Air must therefore be removed from the water segment without pipeline shutdown, requiring the air location and length in the pipe be judged more accurately, and not just by observation.
The following analysis and equations will help determine the location and length of intake air in the pipe, making air exhaust more accurate and efficient.
Analysis
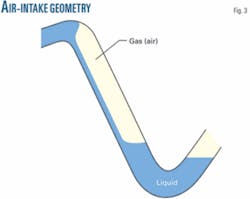
In downward-inclined pipeline segments, the flow pattern looks slack during water filling after the head of water overtops the peak of segments. Water arriving at the bottom of the pipe segments generates a liquid, sealing a certain amount of air in the segments (Fig. 3). Air sealed in this manner represents the majority of the air captured during commissioning. A generated equation can evaluate the volume of the air sealed in the downward inclined segments.
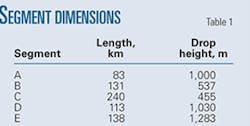
Along the whole CWPP are five segments with large drops; A, B, C, D, and E (Fig. 2). Table 1 shows the length and drop of each segment. During the commissioning process the operator should pay particular attention to segments A, D, and E, which have short lengths and large drop heights, capturing a larger amount of air than the other segments.
The height difference and gravity usually cause the downstream pressure of a downward inclined pipe segment to be higher than the upstream pressure, making the two-phase flow in the downward inclined segment much different from the two-phase flow in horizontal or upward inclined segments. Flow patterns depend on pipe inclination angles, liquid velocities, and pressures.
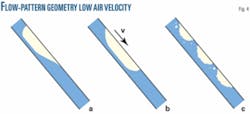
Three flow patterns typically emerge during low air velocity pipeline commissioning (Fig. 4). After being sealed in the downward inclined segment air often accumulates, forming an elongated bubble with the pressure increasing in the segment. Certain pressures and liquid velocities can create an equilibrium of forces at each point of the elongated bubble, causing the bubble to become stationary inside the segment (Fig. 4a).
If the liquid velocity increases, the elongated bubble will begin to move at a velocity determined by the interfacial friction between the water and air (Fig. 4b). A sufficiently high liquid and air velocity will cause the flow pattern in the pipe to change, creating a slug flow or dispersed bubble flow in the segment (Fig. 4c).
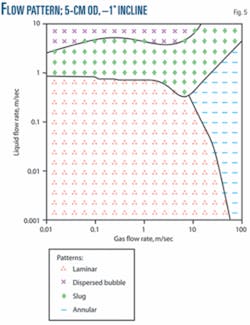
Safety considerations require restricting the commissioning flow rate to low values. CWPP’s liquid velocity measured <1 m/sec. Taitel, Sarica, and Brill recommended a flow pattern map based on Barnea’s model for a water-air system with a 5-cm OD and -1º inclination angle (Fig. 5).1 2It shows the low flow rates and small downward inclination angles cause the flow pattern to tend to laminar, with other flow patterns-slug flow, dispersed bubble flow, annular flow-seldom occurring. The calculation in this article therefore aims at laminar flow; calculating the location of air and length of air mass in a laminar state and ignoring other potential flow patterns.
Calculations
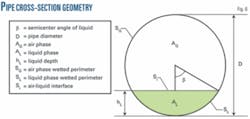
Fig. 6 shows the parameters of the pipe cross section. Certain geometric relations exist among these parameters. β is the semicenter angle of liquid. D is the pipe’s diameter. SG is the air phase wetted perimeter, defined as SG = D(π-β). SL is the liquid phase wetted perimeter, defined as SL = Dβ. Si is the interface perimeter, defined as Si = Dsinβ. Equation 1 calculates the void fraction, φ.
Nicholas3 presented the correlation derived from the Manning Formula, in which f is the liquid friction factor of slack region, f0 is the liquid friction factor of tight line flow, z is height, x is mileage, and v0 is the velocity of tight line flow (Equation 2). The numerator on the right hand is the elevation gradient in the slack region, equal to the head gradient in the slack region. The denominator of the right hand side is the tight line head gradient.
Since the friction factor does not change rapidly with velocity for most pipeline flow rates, f/f0 = 1. According to Equation 2, β is only correlated to the pipe downward inclination angle, θ, and tight line flow velocity, v0.
Fig. 7 shows the correlation characteristic among them. Equation 3 calculates the value of air mass sealed in the pipe, in which M is the value of air mass, ρ0 is the air density at atmospheric pressure, L0 is the length of downward inclined segment, and A is the area of pipe cross section.
Air length
Precalculation assumptions for the two-phase flow segments include uniform air density and void fraction at each point along the segments. Taitel presented equilibrium equations for both liquid and air phase (Equations 4 and 5),4 where shear stresses τg, τi, and τl can be expressed as Equation 6.
In these equations g is acceleration of gravity, ρ is density, p is pressure, and v is velocity. Subscripts g, l, and i refer to the air, liquid, and interface, respectively. A constant value, fi = 0.0142, provides the interfacial air-liquid shear stress, τi.5 Equation 7 approximates liquid shear stress’s, τl, friction factor, fl. The Colebrook-White Formula recommended by Xiao6 can calculate turbulent flow’s fl.
Where e is the absolute surface roughness of the pipe inner wall, Rel = ρlυlDl/μl, with Dl = 4Al/sl, and μl as liquid dynamic viscosity, can define liquid Reynolds Number Rel. The tiny air velocity causes air shear stress, τi, to tend to zero.
Equation 4 allows both the shear stress and the gravity force of air to be neglected because of their tiny values. Equation 8 can therefore express Equations 4 and 5. Substituting Equations 1, 6, and 7 into Equation 8 yields Equation 9, where ρag is the air average density calculated by Equation 10.
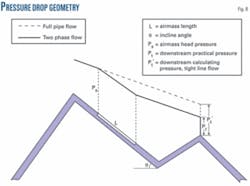
Two unknown quantities exist in Equations 9 and 10: air length, L, and semicenter angle, β. One more equation will close the equations, making them solvable. Equation 11 is a simplification of Equation 4. Integrating Equation 11 yields a linear pressure drop expression, Equation 12, where ∆p is the pressure drop at the two-phase flow region. The air mass in pipe creates a different pressure drop from that seen in tight line flow (Fig. 8).
Equation 13 closes the equations, where ∆p’ is the pressure drop on tight line flow condition, Pt’ is the calculating pressure of downstream on tight line flow condition, and Pt is the practical pressure of downstream. Substituting Equations 1, 6, and 7 into Equation 13 yields Equation 14, in which pli is the pressure drop per unit pipe length. Combining Equations 9 and 14 solves the unknown quantities L and β, while Equation 1 calculates the void fraction.
Air location
Figuring the air mass length and void fraction lets Equation 10 calculate the air mass average density, ρag. Equation 15, the state of gas equation, in which T is absolute temperature and R is the gas constant, yields the air mass average pressure, Pag. Fig. 8 shows discovering the pressure of the air mass head, Ps, can directly disclose the location of the air mass. Equation 16 shows the correlation between Pag and Ps.
Substituting Equations 6 and 12 into Equation 16 yields Equation 17.
Fig. 8 shows the uniqueness of the pressure at each point on a downward inclined segment. The point of air mass head occurs at the two-phase flow, and the pressure before this point can be calculated as a tight line flow condition. Obtaining the pressure of the air mass head yields the location of the air mass by comparing it with the pressure of a tight line flow condition.
Results
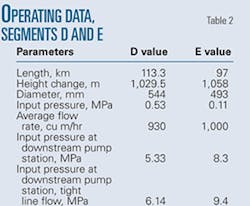
CWPP segments D and E (Fig. 2) are the high air-intake occurrence areas. Practical data analysis and staff reports show active air intake in the two segments. Table 2 shows the operating data of segments D and E. Table 3 shows the results of subsequent calculation.
null
The two segment calculations show the air mass sealed in the pipe depends on pipe diameter, liquid flow rate, downward inclined pipe length, and inclination angle. Increasing pressure compressed the length of air by about 50% and also led to changes to the void fraction, which balanced the pressure difference from interfacial friction. The results confirm the air will not stagnate at the peak but will at certain other determinable points during normal transport conditions.
References
- Taitel, Y., Sarica, C., and Brill, J.P., “Slug flow modeling for downward inclined pipe flow: theoretical considerations,” International Journal of Multiphase Flow, Vol. 26, pp. 833-844, 2000.
- Barnea, D., “A unified model for prediction flow pattern transitions in the whole range of pipe inclination,” International Journal of Multiphase Flow, Vol. 13, pp. 1-12, 1987.
- Nicholas, R.E., Simulation of slack line flow tutorial. Pipeline Simulation Interest Group, Albuquerque, NM, Oct. 19-20, 1995.
- Taitel, Y., and Dukler, A.E., “A model for predicting flow regime transitions in horizontal and near horizontal gas-liquid flow,” American Institute of Chemical Engineers Journal, Vol. 47, 1976.
- Cohen, S.L., and Hanratty, T.J., “Effects of waves at a gas-liquid interface on a turbulent air flow,” Journal of Fluid Mechanics, Vol. 31, pp. 467-469, 1968.
- Xiao, J.J., Shoham, O., and Brill, J.P., “A comprehensive mechanistic model for two-phase flow in pipelines,” SPE 65th Annual Technical Conference and Exhibition, New Orleans, Sept. 23-26, 1990.
The authors
Zhang Nan ([email protected]) is a PhD student at Beijing Key Laboratory of Urban Oil and Gas Distribution Technology, China University of Petroleum-Beijing. He has also served as petroleum engineer at China Petroleum West Pipeline Co. and China Southwest Products Pipeline Co.
Gong Jing ([email protected]) is a professor at China University of Petroleum-Beijing. She also serves as deputy dean of petroleum engineering at the university, concentrating on transportation technology of long distance pipelines and theory and technology of multiphase flow and oil-gas gathering. She holds a PhD from China University of Petroleum-Beijing.


