LNG TRADE-1: Domestic gas statistics shape LNG policies
Looking closely at prevailing natural gas statistics for production, consumption, net export capability, and proved reserves of each country provides insight into how various countries’ natural gas industries are evolving relative to each other and why.
These statistics also help to identify and explain the strategies being pursued by governments and national oil and gas companies in countries where the NOCs control their national industries. This first of two articles concentrates on analysis of these statistics.
Reviewing gas and LNG spark spreads in relation to electricity prices and competing fuels provides insight into the main gas consuming countries. The second, concluding article (next week) will focus on recent spark spreads in selected gas markets and what they reveal about existing and future LNG and gas strategies in those markets.
Statistical framework
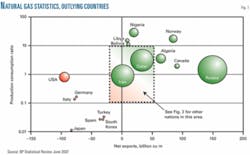
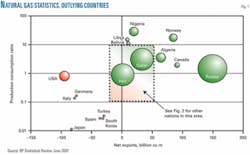
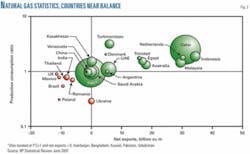
Figs. 1 and 2 show the ratio of natural gas production to domestic consumption (P:C, exporters have a P:C ratio greater than 1) for key countries vs. their net natural gas export position (E-I, exports minus imports; a negative number for net importers and a positive number for net exporters). The bubble size for each country is proportional to its proven natural gas reserves.
Fig. 1 highlights the countries with extreme positions, while Fig. 2 focuses on those lying closer to the origin or central region of the distribution (the vicinity of P:C = 1 and E-I = 0).
These graphs show a significant spread of positions, with the main gas importers trending broadly towards the lower left and the main gas exporters trending broadly towards the upper right. Some anomalies highlighted by these graphs, however, suggest certain countries are following gas strategies inconsistent with their proved reserves holdings. These anomalous countries, in most cases, allow politics to drive natural gas developments.
The P:C vs. E-I graphs referred to in this article compare and contrast gas strategies being followed by nations and, where applicable, NOCs. The discussion focuses initially on those countries highlighted in the more extreme positions (Fig. 1) and moves on to the more centrally located nations (Fig. 2). In the case of some nations, Figs. 1 and 2 also suggest the directions in which countries are likely to move in the short term and long term if they adopt certain gas strategies.
Extreme positions
The two countries at the extreme ends of the net exports spectrum, the US and Russia, are moving in different directions in the gas industry. The US still holds significant reserves, but with consumption outstripping demand at an increasing pace it can be expected to trend further toward the lower left.
US strategy will focus on security and diversity of supply at competitive prices. Russia, on the other hand, holds the largest reserves and will trend further towards the upper right of such graphs in the future.
Russia’s gas strategy, clearly manifest through the actions of Gazprom in recent years, focuses on diversifying its entry points into Europe by building new pipelines, reaching new markets with LNG projects, opening new markets by building pipelines to China from East Siberia, controlling gas exports from the Caspian states, and limiting access of its gas supply competitors to the Western European market.
High domestic gas consumption at low prices leads to a lower Russian production-consumption ratio than might be expected. Increasing exports, a shrinking population, and domestic energy efficiency measures will likely increase this ratio in the medium term. At the same time, however, Russia faces problems of timely investment into major infrastructure projects and overcoming large customers’ suspicions of its political motives. A strategy involving strategic alliances with both large utilities and international oil companies with substantial gas sales positions in its key markets has emerged to address these problems.
Canada has benefited for more than 2 decades as the main gas exporter to the US. With falling reserves in traditional gas producing areas and increased domestic gas demand (including expanding demand for use in tar sand exploitation), however, Canada is unlikely to be able to move further to the upper right in Fig. 1, even with development of the Mackenzie Delta and Northern Territories gas resources.
Future strategies will focus on balancing domestic gas demand with exports to the US and preparing for a long-term future as a gas importer. Projects to build LNG receiving terminals show that Canada recognizes these issues. It also seeks to act as a gas transiting point for importing gas to the US, securing its own long-term supply sources along the way.
The main gas importing nations (Japan, Germany, Italy, Spain, South Korea, Turkey, etc.) plot distinctly in the lower left quadrant of Fig. 1 and are likely to move further in this direction as their demand for imported gas grows. Their bubble sizes on the graph clearly show their paucity of reserves.
Security and diversity of supply will continue to drive the strategies of these countries; with reliable suppliers unlikely to exploit periods of supply shortages for short-term.
Norway holds a position on Fig. 1 to which many gas suppliers aspire. Its low population and close geographic and political ties with Western Europe allow it to maintain this position. Its strategy focuses on developing further infrastructure ties with both Western and Eastern Europe and exploiting Barents Sea gas resources.
Norway’s substantial gas reserves and ongoing investment through its partially state-owned company, Statoil, position it well to control the pace of key gas supply-chain developments and will allow it to move further into the upper right quadrant of Fig. 1 in the medium term.
Long-term cooperation with Gazprom with respect to development of the Barents Sea, however, has not yet emerged. The emergence of a strategic alliance between Statoil and Gazprom could have a major impact on global long-term gas supply dynamics.
Algeria has been exploiting its large gas resource base and proximity to southern Europe for several decades through pipeline and LNG projects. It has secured substantial capital investment in its gas sector by cooperation with IOCs, and continues to do so.
Algeria has in recent years followed a strategy, through its NOC Sonatrach, to extend its controlling share in projects involving IOCs and seek higher prices for its gas in tight-supply markets. This strategy may lead some of its customers to diversify and jeopardize future investments to expand infrastructure, thereby inhibiting its ability to achieve full market potential. Algeria, however, should move further to the upper right in Fig.1 over the medium term, driven by new pipeline, LNG, and potential GTL projects.
Nigeria’s large gas resources and limited domestic use for them and, in spite of rapid growth in LNG, still limited exports, place it in an unusual position in Fig. 1. How fast this changes depends on how the country deals with unrest in the delta communities and if it recognizes the advantages of using domestic gas for power generation. As both gas exports and domestic consumption grow, Nigeria should move to the right on Fig. 1.
The National Nigerian Petroleum Co. continues to take a substantial interest in LNG development projects, cooperating with IOCs through production-sharing contracts offshore and joint-venture arrangements onshore. This strategy places the risk on the IOCs, which also provide the technology and investment. It has worked quite well for NNPC and is likely to continue.
In order to move right on Fig. 1 rather than up and right, however, NNPC might have to invest more directly in developing both its own gas use and the energy infrastructure integration of its Gulf of Guinea neighbors, relying less on IOCs for financing and developing its domestic energy sector, particularly the building of gas-fired power plants.
Oman, Myanmar, Libya, and Bolivia lie in a similar position to Nigeria on Fig. 1, but with substantially lower gas reserves.
Oman’s limited proved gas reserves will force its further movement to the upper right. State-controlled Petroleum Development Oman focuses on exploration in an effort to find more reserves and maintain or perhaps expand existing Oman LNG facilities.
The other three countries all have the potential to move straight to the right on Fig. 1.
Bolivia is unlikely to do so without political change, as state Yacimientos Petrolíferos Fiscales Bolivianos’ nationalization strategies will likely inhibit foreign investment and additional gas export projects.
Libya’s state-owned National Oil Co. is pursuing a recently adopted strategy of extensive cooperation with IOCs for exploration and production investment and technology. Libya must prove substantial additional natural gas reserves, however, to make significant movement to the upper right on Fig. 1.
The country’s nearness to southern Europe suggests that Libya should be able to adopt similar gas development strategies as neighboring Algeria. Undertaking construction of the Green Stream gas pipeline to Italy in cooperation with ENI SPA demonstrates that Libya’s future gas development lies in both pipeline and LNG exports, but remains reserve constrained.
Myanmar, through state-owned Myanmar Oil & Gas Enterprise, is also expanding exports and gas development through recently announced pipeline projects to China and the expansion of existing pipelines to Thailand.
Central examples
Qatar, with its massive gas resource base, is moving rapidly towards the upper right on Figs. 1 and 2. Large new capacity, including liquefaction plants, pipelines, and GTL and petrochemical projects should prompt a short-term rapid increase in net gas exports.
Qatar Petroleum continues to follow a strategy of diversification through close alignment with IOCs. In doing so it also maintains a large controlling interest in all gas development segments, including shipping. It is also actively seeking equity involvement in regasification infrastructure and other downstream assets along the LNG supply chain.
QP’s main problems will be delivering its vast gas development projects on schedule and within budget and efficiently managing its vast portfolio of LNG assets. Political issues among Persian Gulf nations also may inhibit or delay continued planned gas infrastructure expansion by Qatar.
Iran and Venezuela remain rooted to the P:C = 1 and E-I = 0 spot in Fig. 1 despite vast gas reserves. Political issues dominate the gas strategies of both countries’ state-owned companies. Both have been discussing LNG and GTL projects with IOCs for many years, but project-control issues and lack of confidence from IOCs that their investments would be honored within a stable legal framework have prevented any such projects from being completed.
Both countries have the potential to move well towards the upper right in Fig. 1, but without IOC involvement in project management, technology, and financial risk they are unlikely to do so in the medium term.
Both Iran and Venezuela have developed gas resources for domestic consumption, but their extreme political positions have impeded development of long-term relationships with international gas buyers, stunting the development of export markets.
Both countries are also actively negotiating long-distance, politically problematic, gas pipeline initiatives: Venezuela’s Gaseoducto del Sur, linking across Brazil to Argentina; and the IPI pipelines, linking Iran to Pakistan and India. The political and economic problems these projects face, however, may prevent either from being completed.
Saudi Arabia also lies at Fig. 1’s origin, having followed a strategy of not exporting natural gas, but instead focusing on domestic energy projects and development of its petrochemical industry. State-owned Saudi Aramco has developed its gas resources in line with this strategy without the direct involvement of IOCs, one of the few nations to have succeeded in doing so.
No current indication exists that Saudi Aramco intends to adopt a gas export strategy or enter LNG supply.
An important trend affecting the Middle East region generally with respect to gas, and specifically with respect to LNG, is that the international oil companies are maintaining their hold on the technologies required to develop gas supply chains, leaving the NOCs under equipped to do so.
Also, by 2010, Saudi Arabia’s domestic consumption of natural gas will reach 9-12 bcfd. Saudi Arabia and the Middle East in general are increasing their use of gas for generating electricity, one of the main reasons gas production is set for growth in both the Middle East and developing Asian nations, even amid uncertain exports.
Both China and India, two of the largest energy consumers in Asia, have worked to increase their natural gas supplies and develop the infrastructure needed to import gas, especially as LNG, into their markets. Their respective national oil companies, Chinese National Offshore Oil Corp. and Oil and Natural Gas Corp. Ltd., are participating in international upstream exploration projects for oil and gas, with a view toward increasing upstream supplies. Both have preliminary agreements for gas cooperation with Iran involving large scale LNG and pipeline projects.
Growing energy demand and the international strategies being pursued by these countries suggest that they will move further to the lower left on Fig. 2 as the gap between domestic supply and demand widens.
The Netherlands should move rapidly towards Fig. 2’s lower left over the next few years, as domestic gas reserves become depleted.
It plans to build new LNG regasification plants to satisfy both future gas import requirements and to position Rotterdam as a significant Northwest Europe gas hub.
Indonesia should also move to the lower left as domestic energy demand and resultant gas consumption increase and reserves supplying existing liquefaction plants deplete in spite of ongoing development of the Tangguh LNG project. Indonesia’s strategy focuses on exploring for more gas reserves in conjunction with IOCs and building domestic regasification plants so it can meet future demand for power generation.
Malaysia’s domestic gas consumption poses less of a problem than is the case in Indonesia, but limited growth potential in proved reserves constrains its gas export potential. State-owned Petronas has long used international involvement, both upstream and downstream, simultaneously cooperating and competing with IOCs. The existing demands on its gas resource base will likely prevent Malaysia from moving much farther to the upper right on Fig. 2.
Australia and Egypt plot in similar positions on Fig. 2 and, underpinned by rapidly expanding gas resource bases evolving from ongoing successful offshore exploration programs, both should be able to use LNG developments to move further the upper right of the graph, probably changing positions with Indonesia within the next decade. September 2007 announcements of new LNG sales contracts, reportedly at high prices, for Australia’s Gorgon (Shell-to-China) and Browse (Woodside-to-Japan) Northwest Shelf Projects have given that country’s LNG industry new momentum.
Trinidad and Tobago plots in a similar position to Australia and Egypt on Fig. 2 but has a more problematic gas reserve base. Doubts about its ability to prove enough gas reserves to sustain further LNG expansion somewhat offset its advantageous position with respect to the North American market and its extensive recent expansions to its liquefaction capacity.
Its rapid LNG development strategy, however, has turned it into the largest gas exporter to the US. It seems likely that Trinidad and Tobago will continue to exploit whatever reserves it can develop to sustain that strategy.
The Caspian states all have the potential gas reserves to become significant gas exporters in the coming years, subject to pipeline development. Russia continues to have a significant political influence on Turkmen, Kazakh, and Uzbek gas exports, working against any movements that do not flow across its territory. At the same time, however, Azerbaijan has become a gas exporter through the South Caucasus Gas Pipeline into Turkey.
Their landlocked nature prevents the Caspian States from participating directly in LNG supply chains. But all have the potential to move significantly to the upper right on Fig. 2 by supplying pipeline gas to Europe, China, and Russia. To the degree that their own politics become involved in the process, however, this potential may be under-realized in the short-term.
The gas consuming nations in the lower left quadrant of Fig. 2 all seem destined to move rapidly further in that direction. The UK and Mexico are actively building new LNG regasification infrastructure to complement and diversify supply from their pipeline networks.
Mexico, if it adopted a cooperation strategy with IOCs and attracted investment and technology to explore and develop offshore Gulf of Mexico resources could potentially move into the upper right quadrant. But Pemex’s isolationist strategy seems set to continue, leaving Mexico to accept its position as a net gas importer. Perhaps reaffirmed strategic technical cooperation contracts between Pemex and Petrobras, and separately with Statoil, mark a change in this approach.
Brazil, Chile, Poland, and Thailand are planning to build strategically located regasification terminals to increase the security and diversity of their gas supplies away from existing import pipelines.
LNG import strategies in South America offer security and diversity of supply options that can mitigate the political and economic risks of relying on limited sources of pipeline supply. Both Brazil and Chile have learned the costs of overreliance on pipeline supplies from Bolivia and Argentina, respectively.
LNG is now plays an important role in the gas supply strategies of most countries identified on Figs. 1 and 2. Production, consumption, net export, and reserves trends and statistics, however, to not determine these strategies on their own. Strategies vary significantly based on the way gas is contracted and competes with other power generation fuels.
The second article in this series will use recent spark spreads between competing fuels in selected gas import markets to compare these strategies.
The author
David Wood ([email protected]) is an inter- national energy consultant specializing in the integration of technical, economic, risk, and strategic information to aid portfolio evaluation and management decisions. His work focuses on research and training across a wide range of energy related topics, including project contracts, economics, gas-LNG-GTL, and portfolio and risk analysis. He holds a PhD from Imperial College, London.


