New methods ease multiline stray-current measurement
Increasingly complex matrices of potential stray-current corrosion sources have made mitigation of potential problems both more difficult and more important. New techniques that use new hardware and software, however, have made detecting and locating stray current more efficient and intuitive.
Many factors have caused both the risk from and presence of stray-current corrosion to increase sharply in the past decade. These include:
- Increased use of underground construction.
- More crowded right-of-ways, with more sources for static stray current.
- More sources of dynamic stray current from mines, DC rail, and other dynamic sources.
- Increased cathodic-protection currents due to aging pipeline systems, raising the current necessary for protection.
- Increased loads of mines, DC rails, and other systems, raising the current demand from these systems and potentially increasing the potential for stray-current corrosion.
Background
The four main methods of detecting and measuring stray currents are:
- Voltage measurements and recording. To be accurate, these measurements must be logged for intervals, ideally synchronized with other measurement stations. Time stamping the readings allows their presence to be compared to external events. This technique does not report current movement, only the related change in potentials.
- Current span-line drop. Ohm’s Law says the flow of a current through a resistance creates a voltage. Manufacturers’ tables provide or allow calculation of the resistance per unit length of gas pipe. Measuring potential at two points allows calculation of the current. A longer run helps reduce errors.
This method can prove difficult in application for a number of reasons: Access points may be difficult to gain entry through; such points may be rare or distant; changes in pipe diameter or construction, especially if undocumented, will affect the calculation. Replacement of gas lines with plastic sections, even if tracer wires are bonded through, will have drastic changes on impedance. - Current clamp-on meter. Two varieties of this method exist; both connect a pickup coil completely around the pipe. Existing pipelines require an excavation or connection at a suitable aboveground point. Installation can also occur either at the time of construction or as part of a survey program. Permanently installed coils will use leads brought up to a sealed enclosure where temporary or permanent test equipment and loggers can be connected.
- Electromagnetic stray-current mapping. This is the newest technique and provides the main focus of this article. A consortium including the Northeast Gas Association, Gas Research Institute, and a number of operators in North America and Europe developed the technique, seeking to create a tool that was easy to deploy and intuitive to use.
Since the flow of any current results in an electromagnetic field, measuring and making calculations based on the EM field surrounding a pipeline would allow all required data to be deduced. The EM inertness of most types of ground cover (dirt, sand, water, asphalt, and concrete) allows measurements to be taken above ground.
The sensors have to respond from very low frequencies (down to DC) up to several harmonics of power-line frequency. Traditional antenna coils do not respond to low frequencies very well, but modern solid-state magnetometers do.
Arranging them in vector pairs or triads allows both the magnitude and direction of the EM fields to be measured. Arranging several sets of sensors along a length gives all the information needed to determine the size, shape, intensity, and depth of an EM field. These readings in turn allow easy calculation of the magnitude and direction of the current causing the EM field.
Adjacent large or moving masses of metals and EM fields on adjacent utilities alter EM fields. As EM fields increase exponentially with decreasing distance, positioning the sensors closer to the desired EM field quickly negates the effects of any distorting fields. Pushing an optional sensor developed for these applications into the ground gets the magnetometers closer to the pipe under test. A simple T-handle probe or plunger bar with sensors along its length completes this task.
The accelerated recording rate brought about by efficient large-capacity modern memory allows determination of whether a signal is periodic.
For example, a reading taken once per second would suit recording slow changes such as telluric currents but would completely miss higher frequencies (such as 60 hz), which would show up as random noise. Sampling faster than the target frequency will capture its limits. The Nyquist theorem must only be met if an exact reconstruction is required.
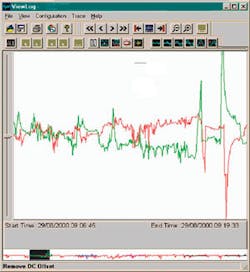
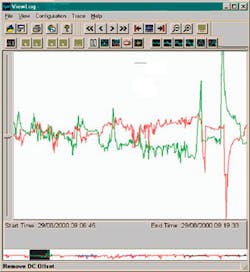
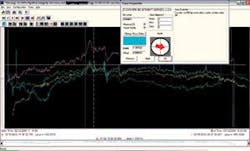
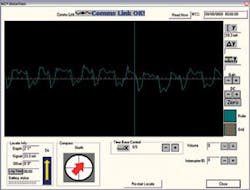
Software written to analyze stray-current mapping data easily scales the data to suit the operator. The Y-axis displays current and voltages, the X-axis, time (Fig. 1). Overall data trends appear easily, as do areas of interest.
Placement of two pairs of cursors causes the program to display the change in time and changes in current or voltage. The relative placement of the bar during the fieldwork stage of an SC survey shows the direction of current, requiring use of checklists and notes for each deployment point.
Theory
Interfering currents can be either dynamic (electric rail) or static (other cathodic protection systems in steady-state operation). Observing the currents flowing on the target pipeline provides one step in solving an SC problem. Confirming the SC source, however, requires slightly different approaches for each current type.
Dynamic currents fluctuate, making stray currents difficult to identify. Localized magnetic fluctuations can also create interference and must be filtered out. Measurements near electric-rail systems, to simplify the survey, must reflect normal operations. Rail system movements are unique enough, however, that the patterns of current change can both identify the system itself and allow identification (and invalidation) of unrelated magnetic fluctuations.
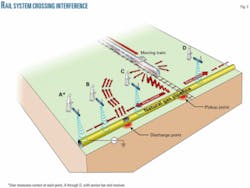
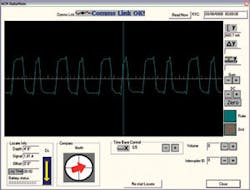
The technique requires two SC detection devices, one near the expected pickup point and a second roving bar that takes measurements at a succession of points along the pipeline (Fig. 2). Loading all readings into the software simultaneously makes a number of analysis tools, both manual and automatic, available.
Readings at one bar that do not appear at the other show a local magnetic anomaly, a vehicle passing by for example, and are discounted. Comparing remaining readings with similarly shaped indications shows the difference between the calculated magnitudes of current and how much current has been gained or lost between the position of the reference bar and the position of the roving bar. Comparing these changes in current along the length of the pipeline makes areas of pickup and discharge evident.
Static currents may also exist, such as a foreign CP system suspected of adding or discharging current from the target system. Cooperation between the operators of the different systems makes these currents easier to confirm. Interrupting the currents with a unique pattern identifies each source.
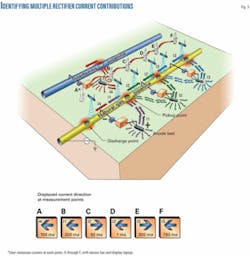
Using multiple patterns and synchronized interrupters will allow different sources to be identified; whether each individual rectifier or the entire system. Suitable software on the measurement devices or on the analysis computer will automatically calculate the magnitude and direction of any currents on the pipeline occurring at these unique patterns.
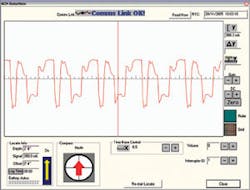
Moving the measurement bar along the target pipeline and observing the currents in the test locations will complete an SC survey. Crossing a pickup or discharge point causes an observable change in the reported current (Fig. 3).
This system can also measure AC currents, though their synchronization makes interrupting suspected sources difficult. Inductive energy is proportional to the load on the AC source and may vary with time-of-day. On a three-phase AC system, the balance between the phases also may change, creating an EM field where a well-balanced system had earlier negated it. A long recording ability, however, will allow observation of daylong trends.
Stray-current mapping gathers and quantifies the data in each instance. Analysis of these results by a qualified person allows proper understanding of what the information is saying and how to use it to mitigate problems.
The strength of this method is the ease of gathering the data. Placing the sensor bar on the ground above the target pipeline and setting up a communications link to a properly programmed computer will suffice in most cases.
Case studies
A dynamic stray-current survey on an NGL pipeline is the first case study.
The survey employed a number of testing techniques at various locations but not on the entire pipeline, including:
- Pipe locating (for location and depth).
- Stray-current mapping.
- Pipe-to-soil potential measurements.
- Global-positioning-system survey, accurate within 1 m.
Testing concentrated on the best techniques for each location, including stray-current measurement readings, with all techniques not employed at all locations. The survey attempted to take measurements roughly every 1 mile of the pipeline’s 60-mile length.
Individual recording logs at these various locations recorded 24 hr worth of information, with a total of 96 different logged recordings amounting to about 2,300 hr of logged events. The survey concentrated on accessible areas and areas of known or identified stray-current influence and used the following tools:
- Four stray-current mappers, used to log both current and pipe-to-soil potentials.
- Pipe and cable locator, used for location and depth of cover.
- 4 copper or copper-sulfate reference half cells, for measuring pipe-to-soil potentials.
- Digital multi meter, to check test leads and other areas where the reference cells were attached during the logs.
- Stray-current mapper viewer software used in the analysis of the stray current and pipe-to-soil voltage logs.
- Spreadsheets for the compilation of the data.
- Handheld GPS for recording positions of the flags at the logged locations, accurate within 1 m.
The line surveyed with the stray-current mapper lay in areas with obtainable access to the NGL pipeline and normally in areas with nearby access to a pipeline test station. Placing the SCM across the NGL pipeline occurred in such a way that any forward measurements of the current direction would indicate that the current was flowing downstream (with the normal pipeline product flow) and any backward measurements of the current direction would indicate that the current was flowing upstream.
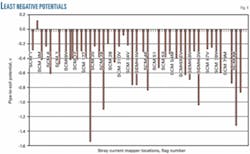
The survey focused on areas of least negative pipe-to-soil potentials and areas with the most current flow at the logged locations.
Fig. 4 shows the least negative potentials at the logged locations. The least negative, and in fact positive, potential lies at SCM flag 3J; a +0.123-v positive value which may be caused by a nearby bare 20-in. line.
The static stray-current survey also identified this area. The next least negative area lay at SCM flag 32, where a -0.075 voltage was logged. Many other events measured less than -0.300 v.
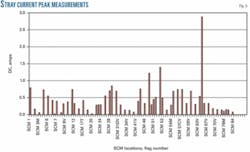
Fig. 5 shows the peak current measurements at the logged locations. The most current measured at any location lay at flag 65 at 2.887 amp. This event did not correspond with events logged at the same time at other locations and may have been localized. A commercial saw mill stood about 0.5 miles from the location.
The two other most significant current flow areas lay at SCM flag 52, with a measured amperage of 1.397 and at SCM flag 47, 1.210 amp; both near a coal mining operation. Other areas along the pipeline have current flows above 0.5 amp, including SCM flags 4 and 6, SCM flags 26D-31D, SCM flags 55-58 and SCM flags 60 and 65.
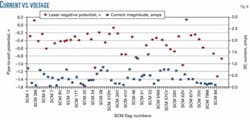
Fig. 6 shows the peak current with the least negative potentials at the logged locations. The least negative potentials are not always associated with the most current flow. Not being at the actual pipeline position where the discharge is occurring likely causes this.
Being very near or on top of the current’s discharge position would likely lead to the least negative pipeline potentials being measured at these locations, provided there was no error in the measurements due to other nearby interfering sources.
SCM flag 30 showed a -0.456 voltage potential and 0.848 amp of current. SCM flag 31D has a 0.232 voltage potential and 0.635 amp of current, and a -0.075 voltage potential and 0.274 amp of current exist at SCM flag 32. These measurements indicate discharge points between flags 30 and 32, with the most significant discharge occurring between 31D and 32.
Other areas with the same types of patterns include but are not limited to SCM flags 46-53, and SCM flags 59-69. These types of patterns can occur in smaller areas and the survey to date may not show all of the patterns occurring between the locations logged. Fig. 7 shows an example of logged current-measurement data at flags 59-65.
Static example
A static stray-current survey conducted with the stray current on an NGL pipeline used the following techniques at various locations but not on the entire pipeline:
- Pipe locating (for location and depth).
- Interrupting current from foreign sources.
- Stray-current mapping.
- Pipe-to-soil potential measurements (in limited amounts).
- 1-m accurate GPS.
The survey concentrated on the best techniques, including stray-current measurement readings from the foreign interrupted current sources. Surveying the 60-mile pipeline took place as needed at various intervals, with a total of 10 different foreign sources of rectified current interrupted.
These interrupted sources of current provided the basis of the survey; unidentified or unknown sources of current that were not interrupted were not measured. Measurements occurred at locations every 0.5-1 mile along the pipeline and before and after every known foreign pipeline crossing using the following techniques:
- GPS current interruption of four foreign transmission pipeline rectifiers from one operator, GPS current interruption of three foreign rectifiers from a second operator, and GPS current interruption of three foreign rectifiers from a third.
- Stray-current mapping to map the distribution of interrupted currents at various locations on the NGL pipeline.
- On and off pipe-to-soil potentials (not logged) at selected test stations.
Much of the line surveyed with the stray-current mapper lay in older areas of the NGL pipeline that had no coating where the pipe-to-soil measurements are low. Placement of the SCM across the NGL pipeline took place such that any forward measurements of the current direction would indicate that the current was flowing downstream and any backward measurements of the current direction would indicate that the current was flowing upstream.
Reviewing SCM measurements on foreign pipelines should take place according to how the bar was set up in relation to the north-south orientation of the pipeline direction indicated on the SCM log screen.
Operator 1 rectifiers. Interference current measurements on the NGL pipeline from these rectifiers do not indicate any substantial amount of stray-current influence. The most current at any one location measured 23 ma at flag 7, upstream from a pipeline crossing (Fig. 9). The limited current measured after the crossing suggests that a discharge of 10-20 ma may be occurring in this area. An anode on the NGL pipeline near this location could be discharging this current. No known bonds exist between Operator 1 and the NGL pipeline.
Operator 2 rectifiers. These interfering sources of current have a more significant effect on the integrity of the NGL pipeline, with the largest source of interfering current coming from one of the rectifiers.
Rectifier 2 affects the NGL pipeline positively until the nearby 20-in. OD pipeline draws close and runs parallel between Flags 3J and 3L, at which point a 1-2 amp charge moves from the NGL pipeline to the 20-in. pipeline (Fig. 10). Both pipelines are uncoated in this area, providing a potential path for current discharge. Pipe-to-soil measurements also show possible current discharge at this location.
A bond wire connects the NGL pipeline and the 20-in. pipeline 1,000 ft south of this location where the pipes enter the ground.
Operator 3 rectifiers. Rectifier 1’s current gradually increases and is beneficial until being mitigated through a direct bond with Operator 3; a maximum current measurement of 390 ma at flag 83S (Fig. 11). The close proximity of an Operator 3 pipeline prevented current measurements north of this area.
An SCM smart probe could ensure all current was mitigated correctly. There is enough net current pick up from Operator 3’s rectifier, however, to protect the pipeline in this area.
Rectifier 2’s current gradually increases and is beneficial until mitigated by a direct bond with Operator 3; a maximum current measurement of 78 ma at flag 83S. The close proximity of an Operator 3 pipeline prevented current measurements north of this area.
An SCM smart probe could ensure all current was mitigated correctly. There is enough net current pickup from the rectifier, however, to protect the pipeline in this area.
The authors
Gord Parker ([email protected]) is managing director of Spectrum External Line Inspection Technologies Inc., Calgary. He has also served as sales manager and pipeline products specialist at Radiodetection and worked as an in-line inspection technologist at BJ Services. He holds an associates degree in electronics engineering technology (1994), with honors, from the Northern Alberta Institute of Technology, Edmonton. He is a member of NACE International and the Association of Science and Engineering Technology Professionals of Alberta.
(Editor’s note: Gord Parker worked at Radiodetection Ltd., Calgary, when this article was written.)
Jim Walton ([email protected]) is president and coowner of JW’s Pipeline Integrity Services, LLC, Southlake, Tex. Walton has been involved with the pipeline industry since 1995 and in the past 5 years has focused on external corrosion direct assessment and associated pipeline integrity issues, including static and dynamic stray-current problems.
