Part 2-Refining dynamics counter public misperceptions
Some have argued that refiners’ recent high income levels are excessive. However, oil refining is a highly capital-intensive industry needing large profits to compensate companies for huge investments. Thus, it is important to put these profits in the context of returns on investment (ROI) compared with other investment opportunities.
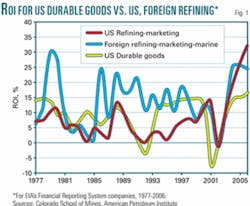
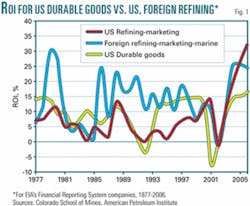
The rates of return on fixed investment in US and foreign refining were calculated as the ratio of net income to property, plant, and equipment, or noncurrent assets, from data reported to the Energy Information Administration by Financial Reporting System (FRS) companies. Fig. 1 shows the ROI for US and foreign refining and US durable goods during 1977-2006.
The figure clearly shows the inadequate US returns of the 1990s. Domestic refining has earned a consistently lower ROI than foreign refining, with higher returns shown in only 3 years during 1977-2002. Only in 2006 did US domestic refining returns surpass foreign refiners’ high ROI of 30% earned in 1980. Over the whole period, ROI for the companies earned from foreign refining averaged more than 13%, almost double that for US refining.
Fig. 1 compares the ROI in US refining with the ROI in the US durable goods industry, which was chosen for comparison because it is a capital-intensive industry that does not include petroleum, and data were available through 2006.
Over the 28-year period 1977-2006, the US durable goods industry earned a 9.4% average ROI, compared with 7% in refining, while at the same time having a lower variability in rates of return. After the 1992 recession, refining struggled to return to historical ROI levels, while durable goods rebounded much more quickly. Even in 2001, after a decade of cost-cutting, consolidation, and restructuring, US refining had not approached the peak ROI being earned in US durable goods. Durable goods returns fell dramatically in 2001, and refining followed in 2002. Only since 2004 has a strong market provided returns in US refining and marketing that exceed the 1990 highs earned in the durable goods industry.
Capacity and investment
Some industry critics emphasize the number of refinery closures in the US and assert that these closures were a deliberate attempt to curtail capacity and increase monopoly power. In fact, the refineries that closed were too small or old to be competitive. Many were originally built to take advantage of oil quotas or price controls that ended in the early 1970s and early 1980s, respectively, and were not viable economically without them.
There were many mergers in the years 1998-2001, with capacity increases averaging 1.7%/year. In 1999, capacity increased by about 650,000 b/d, the largest annual increase since 1974. Between January 2004 and January 2006, refinery capacity increased by 1.4%/year, more than the average rate of increase since 1994. This higher rate of expansion continued despite almost flat total oil product consumption in 2005 and falling total product consumption in 2006.
In addition to investing in new total capacity, US refineries have made heavy investments in coking and hydrotreating, enabling them to make cleaner fuels and take advantage of the increasing price spread between lighter sweet crudes and heavier sour crudes. Although capacity at existing refineries has expanded, no new US refinery has come on line in decades. Two attempts to build new refineries were abandoned in the 1970s after years of battles with regulators, and a planned refinery in Arizona has been 6 years in the permitting process and is unlikely to be completed before 2011, if ever.
While capital investment has not increased as fast as profits, this historically is consistent with other capital-intensive industries, where capital spending is always more stable than profits.
Changes in profits tend to feed back to investment over 3 years because investments take time to plan and implement and must follow long-term demand trends.
On three occasions before 2003-in 1979-80, 1988-89, and 2000-01-the ROI in refining exceeded the 9.4% long-term average return in durable goods manufacturing. In all cases, refiners increased capacity in the same or the following year. In every case, the capacity changes were more muted than the increase in profits, and in every case, profit rates fell to record lows within 1-4 years after the higher investments in new capacity.
Capacity utilization
Some of the growth in US gasoline demand has been met by better use of capacity. The optimum rate of capacity utilization in the US is considered to be 90-95%, with a 95% utilization rate considered to be full capacity because refineries are likely to be hitting process bottlenecks. Rates below 90% suggest that many units are down for maintenance or that refining margins are so depressed that capacity is being taken off line.
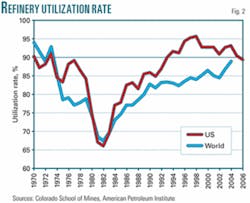
Fig. 2 displays capacity utilization rates in US and worldwide refining since 1970. For most of the last 3 decades, refinery utilization rates in the US have been higher than in the rest of the world. The graph clearly shows the excess capacity and low utilization rates that developed in the 1970s when rising gasoline prices and recession reduced gasoline consumption.
Utilization in the US recovered slowly until 1998, when it peaked at 95% before returning to around 90% through 2002. Then it jumped to about 93% in 2004, with summer peaks even higher. Summer peaks in 2005 exceeded 95%, but annual utilization was lower because of temporary outages from hurricanes Katrina and Rita. In 2006, overall capacity utilization fell to 90%, but summer utilization only fell slightly to 93%. High unplanned outages in the spring of 2007 have put utilization rates lower than normal for this time of year.
Capacity from imports
Because gasoline and other oil products are part of a world market, imports can often offset domestic capacity shortfalls. About 80% of the world’s total refining capacity is outside the US. Foreign refineries have slightly lower utilization rates, and about 90 small refineries have closed since 2000. Foreign refineries have faster capacity growth than US refineries, however, with an especially big jump in 2006. This faster capacity growth was driven by accelerated growth in petroleum product consumption worldwide.
Although US gasoline and blending stock imports are small relative to the total market, they have increased at an annual average rate of more than 9% between April 2000 and April 2007. The imports are a combination of finished gasoline and gasoline blending stocks, with the latter growing more than three times faster because of the different US gasoline specifications and the phaseout of methyl tertiary butyl ether. The majority of imports come into the East Coast and the Gulf Coast regions.
Refining margins
The major driver of profits from refining is refining margins, the spread refineries earn on each barrel of refined petroleum. Beginning in 2004, exceptional US income growth and capacity constraints induced by hurricanes and uncertainties in environmental regulations forced refineries to push equipment to its limits to increase output. Even so, supply was insufficient to satisfy the market’s thirst for clean summer fuels, causing prices to rise in order to allocate the limited available capacity. These price increases produced exceptional profits in US refining.
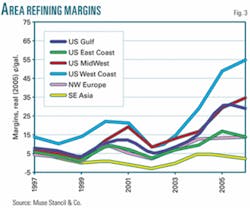
Refinery margins tend to show the same general pattern across all the reported regions except for Southeast Asia (Fig. 3). The claim that refinery profitability is lower overseas is true of Southeast Asia, which has less sophisticated refineries that are distant from the US market. California’s stringent fuel requirements have kept margins considerably higher except during the weak markets of 2002.
But in northwestern Europe, margins very closely track those on the US East Coast, and margins there have not varied by more than 4¢/gal. The Midwest and Gulf Coast also track each other but not as closely, with margins up to 6¢/gal difference. Both margins jumped considerably with the hurricanes of 2005, but in 2006 margins were lower along the Gulf Coast, which has more imports (Fig. 3).
Monthly data show the same pattern across regions, but margins do not track as closely because of the transport time it takes to arbitrage across the various markets. Real margins through May of 2007 are similar to those through May of 2006 except for a spike in the Midwest where margins in May-at 34¢/gal-were more than double those of last year and even exceeded those in California for the first time.
The US Federal Trade Commission, which monitors gasoline prices on a daily basis to watch for monopoly behavior, attributes the current high prices leading to these margins to strong gasoline demand, unplanned outages, and lower imports (see article, p. 22). FTC attributes the lower imports to strong gasoline demand in Europe and Asia.
The current higher profits follow a decade when refining was acutely depressed. Although the restructuring and cost-cutting of the 1990s returned domestic refining to viability, they did not create sufficient market power to protect the industry from the market downturn of 2002 when refining losses were the largest since 1977.
Gasoline inventories
Critics of US refiners have argued that during the period 1990-2005, when gasoline product prices increased by 20%, gasoline stocks fell 6% and that this reduced buffer can cause price run-ups even during small market disruptions such as normal spring maintenance operations.
Gasoline inventories have indeed been declining, not just since 1990, but since 1980.
One might expect the decline in inventories to increase gasoline price volatility. Yet, although gasoline price volatility has been generally trending up, current volatility levels are actually less than in the years 1979-92, when inventories were higher. The volatility in those years is explained by the more-volatile price of crude oil, which was shown in Part 1 to be the major determinant of gasoline prices. Comparing the inventory-to-sales ratios for gasoline, oil products, and manufacturing as a whole shows a parallel pattern of declining inventories. These parallel trends suggest that the trend in oil inventories was driven by the evolution of leaner manufacturing practices throughout US industry, rather than by activities specific to the oil industry.
Market concentration
During 1998-2002, as many as 14 oil companies merged into 7. The perception is that these mergers and acquisitions increased concentration and market power in refining. However, the evidence suggests otherwise. In 1996, only 16 large companies owned and operated 65% of US refinery capacity, but by 2001 their share had fallen to 44%. The percentage of refineries held by the top eight firms fell by almost 10% during 2002-05, suggesting that entry into this industry is not so difficult.
One reason for declining concentration has been the move by major oil companies away from vertical integration by spinning off less-profitable refining assets to concentrate on production. Shifts towards high-volume gasoline stations and increasing hypermarket sales are also believed to have increased competition within the industry.
Futures markets role
What role, if any, does the futures market play in elevating gasoline prices?
Critics argue that speculation in financial commodity markets has bid up the gasoline futures price, which in turn has bid up the gasoline spot price. Gasoline futures contracts typically are used to lock in prices. More than 99% of contracts do not go to delivery, and many traders who are not in the gasoline business purchase contracts hoping to make a profit.
Between fall 2003 and 2005, gasoline futures activity increased to levels not seen since 1993. Historically, about 90% of futures contracts have been held by hedgers or commercial traders in the oil industry, with speculators or noncommercials not in the oil industry holding about 10%. In 2003-05, however, the ratio of noncommercial contract holders doubled to 20%, and most of this increase was in buying contracts (going long).
Critics argue that the actions of these speculators have destabilized the market. Others have claimed that speculators bid up prices by going long in futures. Most economists, however, believe that noncommercials help provide liquidity to the market and allow commercials to shed risk, thereby stabilizing the market and providing advance signals about capacity needs. This would suggest that the increased volume of 2003-05 reflected increased uncertainty that drove both hedgers and speculators into the market to transfer risk.
Theoretically, futures and spot markets are linked as follows: If futures prices rise relative to the spot price, commercials buy spot for inventory (bidding up the spot price) and sell futures contracts (pushing their prices down). The commercials sell off the inventory in the future, lowering future spot prices. Conversely, if futures prices fall, traders sell gasoline out of inventory at the current higher price and buy futures contracts at lower prices. When traders are right, they reallocate inventories to periods of increased shortage and signal refiners when to increase capacity.
Investors are destabilizing only if they are wrong. If investors erroneously expect shortages, then increased inventories today will bid up current prices but cause inventories to be sold at lower prices in the future when no real shortage exists. Although this scenario is possible, it is unlikely to persist for long. Investors who destabilize the market must buy high and sell low, thus losing money. Being wrong in such a game is costly, and market fundamentals quickly reassert themselves.
Alan Greenspan, former chairman of the Federal Reserve, asserts that investors and speculators have correctly identified impending shortages and are “hastening the adjustment process” in world oil markets. Academic studies suggest that the introduction of derivatives reduces price volatility, increases the speed at which markets incorporate adjustment, and may decrease the bid/ask spread.
A study by the Commodity Futures Exchange Commission in 2005 found no link between speculation by hedge funds and money market traders and price changes. They concluded that underlying fundamentals, not speculation, were determining prices.
Gasoline prices may also feed back to crude oil prices. Increasing gasoline demand can bid up gasoline prices, increase crude oil demand, and increase crude oil prices. Such a pattern is consistent with a market-based increase in gasoline prices. Many argue that monopoly power has led to high gasoline prices, which have led to higher crude prices. This argument, however, is logically inconsistent. If higher gasoline prices had been caused by monopoly suppliers withholding capacity, this would have had the effect of reducing gasoline consumption and crude oil demand, thus reducing the price of crude oil.
Market elasticities
When refineries are nearing capacity, gasoline consumption and production are both unresponsive to price in the short run. There is some evidence that this responsiveness has become smaller than it was in the 1970s. This means that small shifts in demand or supply have large short-term effects on prices as shown in the monthly data for gasoline price and product supplied. It does not mean that such markets are not competitive or contestable in the long run.
The consumer response to prices is more than 10 times as great in the long run, when consumers may move closer to work, drive less, or buy more fuel-efficient vehicles and hybrids.
Rapidly increasing gasoline imports suggest that foreign refineries provide competition, and the rise of large independent refiners in the US suggests that barriers to entry are not high. Renewable fuels in the form of biodiesel and ethanol may provide some competition, but can only be a significant factor if they are not made from food crops.
Evidence
The simplistic but appealing explanation that mergers, monopolies, and speculators have caused recent high gasoline prices and profits is not supported by statistical evidence. The real reasons have been high crude oil prices, higher operating costs, proliferating grades of gasoline, unexpected demand growth, recovery from low and negative ROI rates in the 1990s, hurricanes, and regulatory uncertainty. Further, the evidence suggests that the higher profits have been accompanied by normal inventory and investment practices.
A recent assertion that refinery capacity should be increased by more than 15% is also not supported by the evidence and would surely lead to the pattern of overcapacity and losses that followed the price increases of the 1970s.
Acknowledgment
The research for this article was supported by the American Petroleum Institute. For complete bibliographic references and statistical support, see http://dahl.mines.edu/api.pdf.


