ESTIMATING DRILLING COSTS-2: Indices describe complexity of drilling directional, extended-reach wells
Using indices to describe and compare drilling complexity and analyzing the efficiency of the energy applied to formations while drilling can improve performance.
The first part of this series reviewed the two main predictive models used to evaluate drilling costs in the US Gulf of Mexico: the joint association survey (JAS) and the mechanical risk index (MRI; OGJ, Aug. 6, 2007, p. 39).
This second part of the survey on drilling cost and complexity estimation models reviews the indices used to characterize the complexity of drilling directional and extended-reach wells: the directional difficulty index (DDI) and difficulty index (DI).
This article reviews the structural basis of the models and their underlying assumptions.
Recently, use of the concept of mechanical specific energy (MSE) in drilling workflows has improved bit efficiency and performance by identifying specific limiters and then reengineering the process. This article highlights advances in use of the MSE to manage and quantify the drilling process.
The final part of this series will present a new approach to estimating drilling costs that combines regression-based techniques as employed in the JAS with the multidimensional attributes of drilling, as incorporated in the MRI, DDI, and DI models.
Directional difficulty index
Schlumberger engineers proposed the “directional difficulty index” (DDI) to evaluate the difficulty in drilling a directional well.1 Key performance measures were identified through a questionnaire and quantified with three drilling factors derived from four primary variables as shown in Equation 1 in the accompanying equations box.
Along-hole depth (AHD) is computed from an elliptical integral and the tortuosity (TORT) describes the total curvature of the wellbore. The primary parameters related to trajectory curvature are bending angle (dogleg angle) and borehole curvature. The multiplicative functional ensures that each drilling factor receives equal weight in the index, but the DDI does not consider the difficulty of drilling the formations penetrated by the trajectory.
An example calculation appears in the accompanying Box 1.
Difficulty index history
K&M Technology Group introduced the DI to characterize the expected difficulty in drilling an extended-reach well. In an extended-reach well, high angles are built before drilling moves on to a distant target.2 The DI resembles the MRI specification, but the weights employed are frequently specified in terms of a one- or two-dimensional functional, as shown in Equation 2.
Factor description
Five grouped factors define wellbores: well path; mud, temperature, and pressure; casing and redrill; well type and learning curve; and equipment capacity.
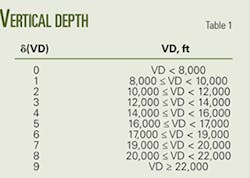
1. Well path. A vertical depth factor δ(VD) employs a stepwise increasing linear function from 8,000-22,000 ft (Table 1). The weight factor is zero for VD < 8,000 ft and saturates when VD ≥ 22,000 ft.
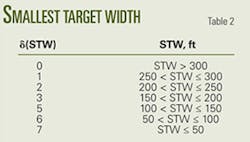
A two-dimensional weight function is defined in terms of the total vertical depth below mud line, VD-WD, and horizontal reach, HD. The smallest target width at TD perpendicular to the well azimuth, STW (ft), determines the weight factor (Table 2).
Because inclination is usually easier to control than azimuth in a deep well, the target width perpendicular to the well trajectory is applied. Shallow wells and very deep wells usually cannot achieve the horizontal reach of aggressively designed moderate-depth wells due to frictional forces and mechanical load limits.
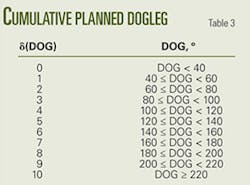
The horizontal reach at TD is computed as the “unwrapped” total length projected onto the horizontal plane. The weight associated with the cumulative planned dogleg at TD, DOG (°), attempts to account for directional changes beyond a simple build and hold plan (Table 3). Applying the cumulative dogleg is similar to the application of TORT in the difficulty index.
The ideal well survey directional plan dogleg is chosen according to well type:
- 2D wells: Inclination changes are added from spud to TD.
- S-turn wells: The cumulative build is added without section doglegs.
- 3D wells: The survey calculation program calculates cumulative dogleg from spud to TD.
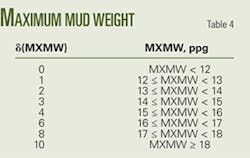
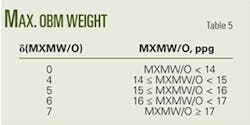
2. Mud, temperature, pressure. The maximum mud weight, MXMW (ppg) and oil-based mud weight, MXMW/O (ppg), factor applies a stepwise, increasing scale to mimic the operational complexity associated with high-mud-weight systems (Tables 4, 5). δ(MXMW/O) characterizes the complexity, risk, and cost due to lost returns and the propagation of existing or induced fractures in abnormally pressured wells.3 If a well is drilled in an underbalanced mode, a weight factor δ(U) = 11 is assigned.
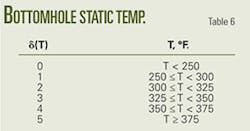
The bottomhole static temperature T(TD) weight factor (°F.) employs a stepwise increasing linear function to account for the additional complexity of managing mud systems and personnel safety (Table 6).
Pore pressure and fracture gradients in the subsurface are uncertain in most drilling operations.4 Using the fracture gradient factor, FG, and the equivalent circulating density, ECD, the string factor NS/ECD assigns a weight depending on the string count and fracture gradient interval (Equation 3). Fracture gradients in hole sizes less than 8½ in. are difficult to drill and can have high ECD due to pipe rotation, cutting pickup when circulation is initiated, and pressure surges due to pipe movement.5 In larger hole diameters, the ECD is lower and usually not an issue.6
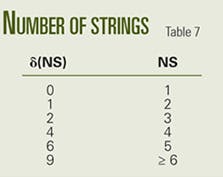
3. Casing, redrill. The number of casing strings and liners below the drive casing is denoted NS, and Table 7 shows the corresponding weight function. For each liner tied back or string requiring rollers, simple flotation, or inverted string weights, the difficulty index gains one point. Two points are for high-angle wells for each casing string/liner requiring the use of differential techniques or rotation to slide into the hole. Additional weights are assigned as follows:
- Wells that require a cased-hole whipstock kickoff or a cement plug kickoff receive two points.
- Drill pipe whipstock slot recovery wells receive five points.
- Fishing operations that require casing string sections to be cut and pulled, milled, or pilot milled receive two points.
4. Well type and learning curve. Exploration wells usually have a higher degree of risk and complexity than a typical development well, and learning economies in development drilling often reduce the difficulty of drilling a series of wells.
Well type and learning is characterized by assigning points:
- 6 points for a rank wildcat.
- 5 points for a near field wildcat.
- 4 points for the first well in a development program, or in areas with no drilling in the past 2 years.
- 2 points for the second well in development program, or no drilling for at least 1 year.
- 1 point for the third well in development program, or no drilling for the past 6 months.
5. Equipment capacity. The drilling rig and system used will affect drilling success; complex systems require additional planning and well time. A jack-up or platform rig with a surface wellhead is assigned the weight “1,” tension leg platforms and spar systems with surface BOPs and subsea hangers the weight “3,” and floaters with subsea BOPs/wellhead the weight “5.”
A number of operational constraints may also arise. Big rigs usually place no constraints on well design or operations but new or stacked rigs may experience extra mechanical problems. If the rig and crew have not previously worked for the operator’s drilling group, additional time may be required. Weight factors are assigned as follows:
- 0-extra capacity rig.
- 3-rig at capacity.
- 6-undersized rig.
- 4-new rig or stacked within 90 days.
- 4-time span between rig activation date and spud date less than 30 days.
- 2-time span 31-60 days.
- 1-time span 61-90 days.
- 2-rig and crew have not worked for the operator within the last 2 years.
DI definition
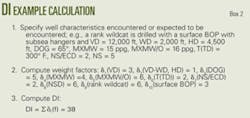
The difficulty index of well w is denoted DI = DI(w) and defined as the summation of the one- and two-dimensional weight functionals, δ(fi) and δˆ(fi, fj), as shown in Equation 4. An example calculation appears in the accompanying Box 2.
DI discussion
The difficulty index is intended to gauge the difficulty of drilling an extended-reach well, and as a gross measure it may be useful to compare the various factors that impact drilling.
Unfortunately, there is no basis to the weight assessment beyond subjective reasoning. The weight functions vary with one or more factors and may be more robust than the drilling factors employed in the MRI, but the weights are not calibrated with empirically derived data.
The DI weight functions are user-defined, similar to the DDI and MRI metrics, and this limits the application of the formula since the weights are not supported by empirical analysis.
It is possible in theory to discriminate among wells on the basis of the tactics employed in drilling, since some of these tactics may be observable, but frequently, most of the tactics are not reported or available for analysis.
MSE history
The concept of mechanical specific energy was defined by Simon7 and Teal8 to quantify the efficiency of the energy used to destroy a given volume of rock. MSE has been used to evaluate the efficiency of drill bits,9 postwell performance analysis,10 and most recently, as a real-time tool to maximize the rate of penetration and obtain a more objective assessment of drilling efficiency.11-14
Drilling rates are often constrained by factors that the driller does not control and in ways that cannot be documented. Dupriest13 classifies factors that determine ROP into two categories: factors that create inefficiency or “founder,” and factors that limit energy input. The three causes of founder are bit balling, bottomhole balling, and vibrations.
Bit balling occurs when material accumulation within the cutting structure interferes with the transfer of energy to the rock. Bottomhole balling is a condition in which the build up of material on the bottom of the hole interferes with the transfer of energy from the bit to the rock beneath it.
Both conditions inhibit transfer of a portion of the WOB to the cutting structure, lower the depth of cut, and reduce ROP. When the bit vibrates it loses cutting efficiency. Whirl refers to lateral vibrations, stick slip refers to torsional vibration, and bit bounce describes axial vibrations of the drillsting.
Other factors may also limit energy input, such as hole cleaning efficiency, hole integrity, mud motor differential pressure rating, and logging rotational speed limits.
MSE definition
The MSE is not a cost or complexity estimation model; it’s an operational tool to optimize ROP and drill the technical limit. MSE is the calculated work that is being performed to destroy a given volume of rock. Teale derived MSE Equation 5, where Tor is the torque and DIA is the diameter of the drillbit.
Lab tests showed that when a bit is operating at its peak efficiency, the ratio of energy to rock volume will remain relatively constant, regardless of changes in ROP, WOB, or RPM. This relationship is used operationally to adjust drilling parameters to avoid founder and to manage the drilling process.
The instantaneous penetration rate depends upon rock strength, borehole pressure, and formation fluid pressures. Typically, increasing borehole pressure will reduce penetration rate in an impermeable rock, while increasing the borehole and pore pressure differential will reduce penetration rate in a permeable rock. ROP is related to the MSE, the bit diameter, and the power input to drilling by Equation 6.
The highest penetration rate that can be achieved under ideal drilling conditions is described by the technical limit penetration rate shown in Equation 7.
Curry correlated rotating days, normal days, and total dry hole days/1,000 m against TLSE for a small set of wells.11 The correlation for rotating days was strong, but for the wider measures of drilling performance, many factors besides drillability affect performance.
MSE discussion
Operations personnel study the performance of successful wells to identify success factors and to duplicate the success. The tendency has developed to use the bit, bottomhole assembly, and directional steering system in offset or similar wells.14
ROP management as practiced by ExxonMobil focuses on the extension of limitations, rather than the identification of superior bit systems. ROP is advanced by identifying specific limiters and reengineering, rather than seeking a better performing system from empirical experience.
The field process for using MSE allows drillers to adjust parameters and observe whether the MSE increases or declines. Parameters are maintained to minimize MSE. After optimizing drilling, engineering redesign is often necessary to adjust nozzles and flow rates to achieve the highest hydraulic hp/sq in.
Dupriest describes the use of MSE surveillance to optimize the drilling process work flow through the identification of the best operating parameters and by providing the quantitative data to costs to justify design changes.12-14
Conclusion
Many factors influence penetration rate and as metrics become further removed from the technical aspects of drillability, additional factors influence the performance measures. Several methods exist to quantify drilling cost and complexity, which attempt to balance the variability involved in the operation with the uncertainty of selecting relevant factors in constructing a descriptive model.
The JAS and MRI are commonly employed in the Gulf of Mexico but relatively little attention has been devoted to the structural basis of the procedures or reliability of the assessment. There have been recent advances, however, in using the MSE to manage and quantify the drilling process.
References
- Oag, A.W., and Williams, M., “The directional difficulty index-a new approach to performance benchmarking,” IADC/SPE 59196, IADC/SPE Drilling Conference, New Orleans, Feb. 23-25, 2000.
- Shirley, Kathy, “Extended-reach drilling: the viable alternative for field development,” The American Oil and Gas Reporter, 46 (4), April 2003, pp. 97-104.
- Tibbits, G., Tek, T., Long, R.C., Miller, B.E., and Black, A.D., “World’s first benchmarking of drilling mud-hammer performance at depth conditions,” IADC/SPE Drilling Conf., Dallas, Feb. 26-28, 2002.
- Proehl, Tom S., “Geomechanical uncertainties and exploratory drilling costs,” SPE/ISRM 78230, Rock Mechanics Conf., Irving, Tex., Oct. 20-23, 2002.
- Hannegan, Don M., “UBD tolls and technology solve conventional deepwater drilling problems,” AADE National Drilling Technical Conf., Houston, Mar. 27-29, 2001.
- “Benchmarking deep drilling final report,” Schlumberger Data and Consulting Services, Pittsburgh, November 2004.
- Simon, R., “Energy balance in rock drilling,” SPE Journal, December 1963, pp. 298-306.
- Teale, R., “The concept of specific energy in rock drilling,” Int. J. Rock Mech. & Mining Sci., Vol. 2, 1965, 57-73.
- Rabia, H., “Specific energy as a criterion for bit selection,” JPT, July 1985, pp. 1225-29.
- Pessier, R.C., and Fear, M.J., “Quantifying common drilling specific coefficient of sliding friction,” SPE 24584, SPE Annual Technical Conf. and Exhibition, Washington, DC, Oct. 4-7, 1992.
- Curry, D., Christensen, H., Fear, M., Govzitch, A., Huges, B., and Aghazada, L., “Technical limit specific energy-an index to facilitate drilling performance evaluation,” SPE/IADC 92318, SPE/IADC Drilling Conf., Amsterdam, Feb. 23-25, 2005.
- Dupriest, Fred E., and Koederitz, William L., “Maximizing drill rates with real time surveillance of mechanical specific energy,” SPE 92194, SPE/IADC Drilling Conf., Amsterdam, Feb. 23-25, 2005.
- Dupriest, F.E., “Maximizing ROP with real-time analysis of digital data and MSE,” IPTC 10706, International Petroleum Technology Conf., Doha, Nov. 21-23, 2005.
- Dupriest, F.E., “Comprehensive drill-rate management process to maximize rate of penetration,” SPE 102210, 2006 SPE Annual Technical Conf. and Exhibition, San Antonio, Sept. 24-27, 2006.


