SPECIAL REPORT: Global ethylene capacity increases slightly in 2006
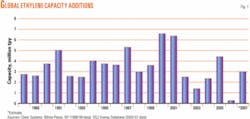
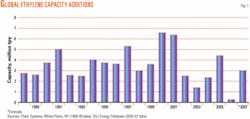
The global ethylene industry added only 245,100 tonnes/year (tpy) of capacity in 2006, a large decrease from the 2005 addition of 4.4 million tpy, according to the latest Oil & Gas Journal survey.
Capacity as of Jan. 1, 2007, was 117.6 million tpy, an increase from a worldwide capacity of 117.3 million tpy as of Jan. 1, 2006. This is an increase of only 0.2%.
The latest survey lists no new plants starting up in 2006. No capacity was removed from the survey due to idled or shutdown plants. All the additional capacity resulted from expansions and debottlenecking at existing sites.
Fig. 1 shows that the capacity additions were the lowest in at least 20 years. Additions should increase in 2007 if all announced projects go online. Many projects expected to go online in 2006, especially in Iran, were delayed.
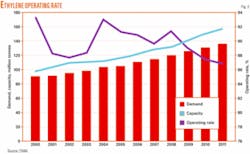
Fig. 2 shows that global operating rates fell in 2006 from a high of about 93% in 2004. This is still a significant rise from the operating levels in 2001-03, when rates ran less than 90% due to stagnant demand growth. Due to significant capacity slated to come online in 2007-11, operating rates should decrease.
Most future growth in ethylene capacity will occur in the Middle East and Asia due to feedstock advantages. North America and Western Europe will experience relatively flat capacity growth. North American capacity growth will continue to be limited due to high natural gas costs.
New units
No new ethylene units appear in this year’s survey. All additional capacity is the result of expansions at existing plants.
Regional review
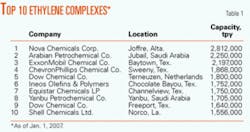
Table 1 shows rankings of the 10 largest ethylene production complexes in the world. Nova Chemical Corp.’s Joffre plant retains the top spot on the list. This list is exactly the same as last year’s.
Table 2 ranks ethylene production capacity by region. North America added 145,100 tpy and South America added 80,000 tpy. Other regions showed very small changes.
On a percentage basis, South America and North America showed the most growth. South America showed the greatest increase (1.62%) due to additional capacity in Braskem SA’s Camacari, Bahia, Brazil, plant. Canada constituted most of the increase for North America. Nova Chemicals Co. reported that the capacity of its Corunna, Ont., plant increased 113,000 tpy to 839,000 tpy.
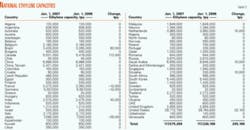
Table 3 ranks ethylene production capacity by country. Canada showed the largest increase, followed by Brazil, for the reasons previously mentioned.
India showed the third largest increase, 40,000 tpy, due to additional capacity in Reliance Industries Ltd.’s Hazira, Gujarat, plant.
Smaller increases occurred in the US, Netherlands, Saudi Arabia, and Slovakia.
Closed, idled plants
Table 3 also shows that only three countries showed a net decrease in capacity: France, Germany, and Japan. Total decrease in these three countries was 55,000 tpy.
No plant in the world announced a complete shutdown; the capacity decreases were all due to partial shutdowns or companies restating ethylene capacity.
The most significant decline was in Japan. Sumitomo Chemical Co. Ltd. reported that its Chiba plant decreased capacity by 35,000 tpy to 380,000 tpy.
Ownership, name changes
There was one significant ownership change in 2006.
Saudi Basic Industries Corp. acquired Huntsman Corp.’s UK base chemicals and polymers business on Dec. 29, 2006, for $700 million. The purchase included Huntsman’s 865,000-tpy ethylene plant in Wilton, UK. The acquisition increases SABIC’s presence in Europe.
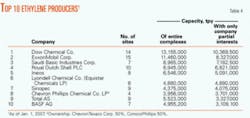
Table 4 lists the top 10 owners of ethylene capacity worldwide. There was one change to the company order. SABIC’s acquisition moved it up to the third spot, overtaking Royal Dutch Shell PLC.
Other changes to this table in 2006 were slight changes in operating capacity.
Construction
Last year, OGJ forecast that 3.9 million tpy of new capacity would come online in 2006, based on responses to construction surveys. Of this, none actually started up.
As with last year’s report, the main reason for this shortfall was that three major projects in Iran again have postponed their start-up dates. Last year, it looked as if three steam crackers (Olefins 7, 9, and 10) would start up in 2006. This did not occur, however; analysts believe that the plants could start up in 2007-08.
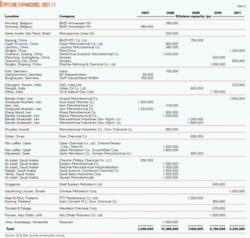
According to the latest OGJ construction data, 3.0 million tpy of new capacity is slated to come on stream in 2007 (Table 5).
The Marun plant is in Bandar Imam, Iran, and is part National Petrochemical Co’s. Olefins 7 complex. The Jam (Olefins 10) and Arya Sasol (Olefins 9) steam crackers are both in Bandar Assaluyeh.
A large amount of capacity is to start up in 2008. More than 15 million tpy of capacity in 17 projects is to come online. Ten of the projects list capacities of more than 1 million tpy. All are in the Middle East except for one in China and one in Venezuela.
Global market
Ethylene markets were again healthy in 2006. Fig. 2 shows that worldwide operating rates were about 91%, a slight drop off from 2004-05, because there was surplus global capacity. Operating rates were high in 2004 when incremental demand surpassed capacity increases.
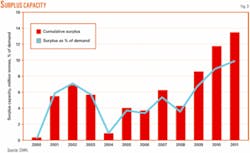
Fig. 3 shows surplus ethylene capacity. According to CMAI, Houston, the global market could become oversupplied by 2010. Their key assumptions are for average demand growth of 4.3%/year through 2011 and average capacity growth of 5.3%/year during the same period. A surplus capacity build of more than 12 million tpy or almost 10% of global ethylene demand is likely to lead to a severe downturn in ethylene industry profitability, says CMAI.
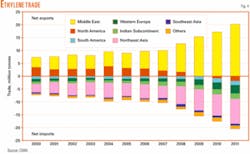
Fig. 4 shows that the Middle East producers will dominate the net equivalent ethylene trade in the future. This graph is for ethylene derivatives; ethylene monomer is too expensive and difficult to handle, therefore, regional trade is limited.
North America will become a net importer by 2009, according to CMAI. And the other regions will import even more ethylene derivatives.
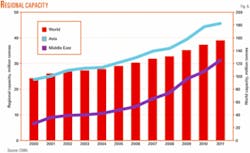
CMAI forecasts that global ethylene capacity will increase by 35 million tpy during 2006-11 (Fig. 5), to a total of 156 million tpy. The graph shows that most expansions will occur in the Middle East and Asia. By 2011, CMAI predicts, ethylene capacity in Asia will exceed 45 million tpy with additions in China, Taiwan, Singapore, South Korea, and Thailand.
Ethylene capacity in the Middle East will approach 30 million tpy, which will place the region on level with North America’s ethylene capacity, says CMAI.
