FIRST-HALF 2007 US OLEFINS: Gasoline price spike shifts ethylene feeds
Dan Lippe, Petral Worldwide Inc., Houston
Extraordinary price volatility in the motor gasoline market had a significant effect on spot prices and price-value relationships for ethylene feedstocks; but prices for primary coproducts lagged the surge in gasoline and feedstock prices. These shifts in feedstock and coproduct price relationships, in turn, influenced ethylene production costs and prompted ethylene producers to make significant changes in feed slates.
Gasoline prices and octane values are significant factors that affect prices for light naphtha feedstocks and key coproducts including propylene, benzene, toluene, and xylenes (BTX). We measure relative strength in gasoline prices using the price differentials between unleaded regular gasoline and West Texas Intermediate (WTI) crude, and we measure octane values using the price differentials between unleaded regular and unleaded premium gasoline.
During first-quarter 2007, refiners normally conduct late-winter turnarounds and complete major maintenance projects before the seasonal increase in gasoline demand. Usually the decline in gasoline production occurs when demand for gasoline is near its lowest level of the year and reduced supply has a minimal effect on prices.
This year, however, according to US Energy Information Administration statistics, motor gasoline imports during March-May 2007 were 200,000-300,000 b/d lower than year-earlier volumes. This unexpected fall in supply compounded the seasonal decline in refinery production; total inventories of motor gasoline declined to a low of 193-194 million bbl (more than 15 million bbl lower than in March 2006) according to EIA’s Weekly Petroleum Status Report.
During fourth-quarter 2006, unleaded regular gasoline-WTI differentials averaged 12.7¢/gal and were significantly narrower than during third-quarter 2006. Additionally, these differentials during fourth-quarter 2006 were only 5.6¢/gal higher than the average for 2001-04.
Unleaded-WTI differentials on the US Gulf Coast remained at reasonable levels in January 2007 but increased to 41.2¢/gal in March and jumped to 80-82¢/gal in May 2007, a new record high for the monthly average.
Olefin plant feed slates
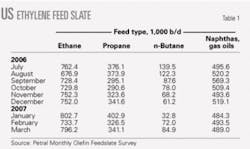
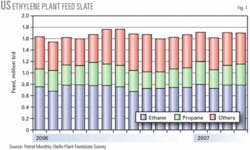
Ethylene industry demand for fresh feed averaged 1.64 million b/d in fourth-quarter 2006 and increased to 1.69 million b/d in first-quarter 2007. Demand for LPG feedstocks (ethane, propane, and normal butane) averaged 1.13 million b/d in fourth-quarter 2006 and increased to 1.2 million b/d in first-quarter 2007.
Ethylene producers cracked a lighter feed slate in first-quarter 2007. Specifically, LPG feeds accounted for 71% of total fresh feed in first-quarter 2007 vs. 69% of fresh feed in fourth-quarter 2006. The shift to lighter feeds continued in April; LPG feeds accounted for 73.6% of total fresh feed. LPG feeds’ share of total fresh feed was previously at this level in May 2006.
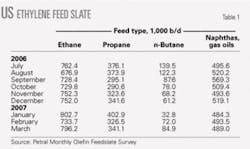
Table 1 shows trends in olefin plants’ fresh feed slates.
Based on projected ethylene industry operating rates of 90-92%, total demand for fresh feedstocks will average 1.70-1.75 million b/d during second and third quarters 2007. Total demand for LPG feedstocks will average 1.23-1.25 million b/d; LPG feedstocks will account for 71-73% of total fresh feed during second and third quarters 2007.
Fig. 1 shows historic trends for ethylene feed slates.
Ethylene production
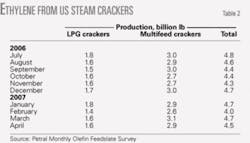
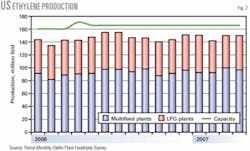
Ethylene production from fresh feed totaled 13.36 billion lb in first-quarter 2007 (Table 2). Ethylene production from steam crackers was 54 million lb less than in fourth-quarter 2006 (less than half a day’s output).
Production from LPG plants totaled 4.78 billion lb in first-quarter 2007 and was 173 million lb less than in fourth-quarter 2006 (about 3 days of production). Production from multifeed crackers totaled 8.59 billion lb in the first quarter and was 119 million lb more than during fourth-quarter 2006 (about 1.5 days of production).
LPG crackers operated at 89% of nameplate capacity (21.6 billion lb/year) during first-quarter 2007. Multifeed crackers operated at 87% of nameplate capacity (40.2 billion lb/year) during first-quarter 2007.
Huntsman Corp.’s ethylene plant in Port Arthur, Tex., remained out of service pending repairs to damage resulting from a fire in late April 2006. Furthermore, Huntsman announced the sale of this plant and other basic petrochemical assets to Flint Hills Resources LLC (a wholly owned subsidiary of Koch Industries, Inc.) in February 2007.
When the ethylene plant at Port Arthur-a multifeed cracker with 1.55 billion lb/year nameplate capacity-returns to service, nameplate ethylene production capacity for multifeed crackers will total about 41.8 billion lb/year.
Fig. 2 shows trends in ethylene production.
US propylene production
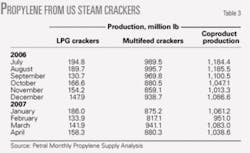
Propylene from steam crackers was 3.1 billion lb in first-quarter 2007, which was 52 million lb less than in fourth-quarter 2006. Propylene production from LPG crackers totaled 462 million lb in first-quarter 2007 and was equal to production in fourth-quarter 2006.
Propylene production from multifeed crackers was 2.63 billion lb in first-quarter 2007, which was 45 million pounds less than during fourth-quarter 2006. Operating rates for multifeed crackers were essentially the same in fourth-quarter 2006 and first-quarter 2007. Ethane’s share of fresh feed in multifeed crackers, however, increased to 31.1% in first-quarter 2007 vs. 28.8% in fourth-quarter 2006. The shift to a lighter feed slate, to some extent due to rising prices for motor gasoline, accounted for the decline in coproduct propylene production from multifeed crackers.
Table 3 shows trends in coproduct propylene production from LPG and multifeed plants.
Refinery propylene supply
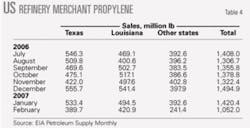
Production trends during first-quarter 2007 were in-line with typical seasonal patterns. Refinery merchant propylene sales (Table 4) were 1.42 billion lb in January 2007 (45.8 million lb/day) but fell to 1.05 billion lb in February 2007 (37.6 million lb/day).
EIA reported a strong rebound in March with total production of 1.34 billion lb (43.4 million lb/day). Production for the first quarter totaled 3.82 billion lb, 380 million lb less than during fourth-quarter 2006.
Based on expected refinery operating rates, gasoline production, and FCCU feed rates, merchant sales of refinery grade propylene will increase to 4.1-4.2 billion lb in second-quarter 2007. Refiners have extraordinary incentives to operate at full capacity rates and to maximize gasoline production. By-product propylene production may be at record high volumes during second and third-quarter 2007.
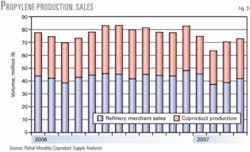
Fig. 3 shows trends in coproduct and refinery merchant propylene sales.
Ethylene economics, prices
Feedstock prices, coproduct values, and ethylene plant yields determine ethylene production costs. We maintain direct contact with the olefin industry and track historic trends in spot prices for ethylene and propylene. We use a variety of sources to track trends in feedstock prices.
Some ethylene plants have the necessary process units to convert all coproducts into high-purity streams. Some ethylene plants, however, do not have the capability to upgrade mixed or crude streams of various coproducts and sell some or all their coproducts at discounted prices. Our estimates of ethylene production costs in this article are based on all coproducts valued at spot prices.
Ethylene production costs
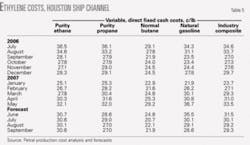
During first-quarter 2007, spot prices for all feedstocks and coproducts increased. Spot prices for natural gasoline increased 19% and spot prices for light naphthas increased 27.5% during January-March. Spot prices for propane, however, increased only 16.5% and spot prices for purity ethane and normal butane increased only 12.9%.
These price increases occurred well before the motor gasoline prices hit their peak in May. Divergence between spot prices for light feeds and heavy feeds occurred during first-quarter 2007 and continued during April and May.
Spot prices for all major coproducts also increased during the first quarter but spot prices for propylene were only 5.5-6.0% higher in March than in January. Spot prices for BTX were 2.5-5.5% higher in March than in January.
The lag in spot prices for major coproducts was a significant factor in the divergence of ethylene production costs based on natural gasoline and similar light naphthas vs. production costs based on ethane. As a result, light naphthas became generally more expensive than ethane, especially during March.
The spike in motor gasoline prices continued during April and May; spot prices for natural gasoline-light naphthas and propane continued to diverge. During April and May, spot prices for natural gasoline increased an additional 14.3% and spot prices for light naphthas increased 13.3%. Spot prices for propane, however, increased only 8.9%.
Spot prices for purity ethane increased 17.7% from March through May. Despite the jump in spot prices for ethane during April and May, variable ethylene production costs for ethane were consistently less than variable ethylene production costs for propane due to the lag in spot prices for propylene.
For ethylene producers that have the capability to market all coproducts at spot prices, however, variable ethylene production costs for ethane were 1-2¢/lb higher than for natural gasoline during April and May. For ethylene producers that market some or all of their coproducts at discounted prices, variable ethylene production costs for ethane were 6-8¢/lb lower than for natural gasoline during April and May.
Production costs for ethylene on the Houston Ship Channel (based on full spot prices for all coproducts) increased to 29-30¢/lb in March from 22-25¢/lb in January. Production costs for ethylene continued to escalate during April and May-the industry composite averaged 33-34¢/lb in May.
Production costs for natural gasoline jumped to almost 37¢/lb in May and were 7¢/lb higher than in March. The 20% increase in production was primarily due to rising feedstock prices resulting from the surge in spot prices for unleaded regular gasoline.
Table 5 shows trends in ethylene production costs.
Ethylene prices, profit margins
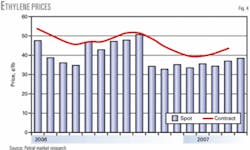
Contract prices for ethylene averaged 40¢/lb in first-quarter 2007 or 4.8¢/lb less than in fourth-quarter 2006. Contract prices increased to 41¢/lb in March from 39.5¢/lb in January and February. Contract prices increased again in April and stood at 44.5¢/lb at the beginning of May.
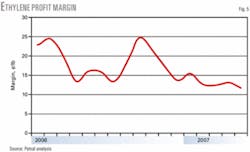
Contract prices for ethylene in April were about equal to the average for fourth-quarter 2006. The rebound in contract prices during March-May, however, was just barely sufficient to keep profit margins steady in the face of rising production costs. Margins based on contract prices averaged 9.5-10.0¢/lb during January-May.
During first-quarter 2007, spot prices for ethylene fluctuated in a range of 34-36¢/lb and averaged 35¢/lb, or 1¢/lb higher than in fourth-quarter 2006. The increase in spot ethylene prices during the first quarter did not keep pace with rising production costs.
Margins based on spot prices and average production costs narrowed to 3.4¢/lb in March from 7.1¢/lb in January. Furthermore, profit margins for naphthas, condensates, and gas oils narrowed to 1.8¢/lb in March from 8.6¢/lb in January.
Spot prices for ethylene increased to 38-39¢/lb in May, but margins based on average production costs remained at 4¢/lb. Margins for LPG feeds averaged 4.6¢/lb in April and May, but margins for naphthas, condensates, and gas oils (averaged) slipped to 2.4¢/lb in May from 3.6¢/lb in April.
Figs. 4 and 5 show historic trends in ethylene prices (spot and net transaction prices) and profit margins based on composite production costs.
Propylene economics, prices
Prices for all grades of propylene move in tandem with each other, and differentials between grades are generally constant within a narrow range. The premium for polymer-grade propylene covers operating costs and profit margins for the various merchant propane-propylene splitters in Texas and Louisiana.
Spot prices for polymer-grade propylene averaged 43.2¢/lb in first-quarter 2007, or 4.1¢/lb higher than in fourth-quarter 2006. Spot prices for both polymer-grade propylene and unleaded regular gasoline rallied during first-quarter 2007, but spot prices for polymer-grade propylene were sharply higher than for unleaded regular gasoline during January and February. The differential between polymer-grade propylene and unleaded regular gasoline therefore widened to 25.5¢/gal (based on converting polymer-grade propylene prices from ¢/lb to ¢/gal) from 14.9¢/gal during fourth-quarter 2006.
Spot prices for refinery-grade propylene rebounded in early January and averaged 40.0-40.5¢/gal during January and February. When spot prices for unleaded regular gasoline and alkylate began to increase during March-May, spot prices for refinery-grade propylene also moved higher, especially during April and May.
Spot prices for refinery-grade propylene averaged 41.1¢/lb in first-quarter 2007. Contract prices for refinery-grade propylene averaged 39.2¢/lb in first-quarter 2007.
After contracts settled for April, spot prices for refinery-grade propylene began to move steadily higher. By late April, spot prices averaged about 49¢/lb or 4.0-4.5¢/lb higher than in early April. Almost immediately after contracts settled for May, however, spot prices for refinery-grade propylene declined by about 5¢/lb.
The seasonal increase in refinery merchant propylene sales began to improve availability and prices fell about 4.5¢/lb within a few days after the contract for May settled at 48.25¢/lb. Based on data for the first three weeks of May, spot prices for refinery-grade propylene averaged 46.25-46.5¢/lb or 1.75-2.0¢/lb lower than the May contract price.
Polymer-grade propylene prices usually command a premium of 4-5¢/lb vs. refinery-grade propylene. During first-quarter 2007, the premium for polymer-grade propylene (contract price basis) was consistently 5.5¢/lb and remained at 5.5¢/lb in April but narrowed to 5.25¢/lb in May.
Octane values, propylene prices
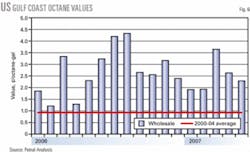
We determine octane’s incremental value using the differential between unleaded premium and unleaded regular gasoline prices divided by the difference in octane (87 octane for unleaded regular gasoline and 93 octane for unleaded premium gasoline).
During January and February, incremental octane values were steady and averaged 1.90-1.95¢/octane-gal vs. an average of 2.7¢/octane-gal in fourth-quarter 2006. The lull in octane values ended abruptly after early March. Incremental octane values jumped to 5.9¢/octane-gal in late March but then began to weaken. Octane values averaged 2.6¢/octane-gal in April and slipped to 2.3¢/octane-gal in May.
Fig. 6 shows historic trends in incremental octane values on the US Gulf Coast.
During first-quarter 2007, price differentials between refinery-grade propylene and spot alkylate were at their peak in January but declined during February-May. Spot prices for refinery-grade propylene averaged 12¢/lb more than for alkylate in January but only 5.3¢/lb in March. In May, the differential between refinery-grade propylene and alkylate narrowed to 2.5-2.75¢/lb.
Summer, fall 2007 outlook
Crude inventories in commercial storage increased during first-quarter 2007. Total inventories of 320-325 million bbl at the end of March were 16-20 million bbl higher than at yearend 2006. Furthermore, crude inventories continued to increase during April and May and reached 340-345 million bbl at the end of May. Crude inventories increased despite OPEC production curtailments.
The significant improvement in crude oil availability portends weaker prices for WTI during third-quarter 2007, if gasoline supplies continue to improve as they did during May.
Gasoline imports were consistently lower than year-earlier volumes during first-quarter 2007. Imports began to increase in April and continued to rise in May but also continued to lag year-earlier levels. Gasoline inventories therefore fell to unusually low levels in late April and remained about 15 million bbl lower than year-earlier levels at the end of May. While gasoline inventories continue to increase, however, the abnormally strong bullish pressures on motor gasoline prices will subside.
Refinery crude runs will increase to peak seasonal rates before the end of June and refinery gasoline production will increase to peak volumes during third-quarter 2007. If gasoline imports continue to increase and average 1.4-1.5 million b/d during June-September, total gasoline inventories will recover to parity vs. year-earlier levels by August.
When the gasoline market begins to recognize these improvements in the near-term outlook for the gasoline supply-demand balance, spot prices for gasoline will fall sharply from their abnormally high levels. Spot prices for unleaded regular on the US Gulf Coast are poised to decline 30-40¢/gal or more during June and July.
When the collapse in motor gasoline prices begins, the various bearish fundamental considerations for crude oil will emerge as the dominant influences on WTI prices. WTI prices will average $60-62/bbl during third-quarter 2007 and will decline to $57-59/bbl during fourth-quarter 2007.
The projected collapse in gasoline prices and the continued decline in octane values will also have a strongly bearish effect on spot prices for propylene and BTX. Spot prices for refinery-grade propylene will average 41-43¢/lb during third-quarter 2007 and 36-38¢/lb in fourth-quarter 2007. Despite these projected declines, refinery-grade propylene prices will average 6-8¢/lb more than spot alkylate during second-half 2007 vs. 4¢/lb in second-quarter 2007.
Prices for all feedstocks and coproducts will decline during second-half 2007, but spot prices for light naphthas and natural gasoline are likely to decline more than for ethane and propane. Composite production costs will therefore decline 3-5¢/lb during June and July. During third-quarter 2007, cash production costs will average 31-32¢/lb vs. about 36¢/lb in May.
LNG Observer covers industry developments
With their July 2, 2007, Oil & Gas Journal, many subscribers will receive the magazine’s quarterly supplement LNG Observer. The third-quarter 2007 LNGO will also be available after July 9, 2007, at www.lngobserver.com.
Produced with the widely respected GTI, Des Plaines, Ill., OGJ’s LNG Observer aims at anyone interested or involved in the natural gas and LNG business.
If you are an OGJ print subscriber and would like to receive a print copy of LNG Observer beginning with your Oct. 1, 2007, issue of OGJ, please contact [email protected] to be added to the list.
The author
Daniel L. Lippe (danlippe @petral.com) is president of Petral-Worldwide Inc., Houston. He founded Petral Consulting Co. in 1988 and cofounded Petral Worldwide in 1993. He has expertise in economic analysis of a broad spectrum of petroleum products including crude oil and refined products, natural gas, natural gas liquids, other ethylene feedstocks, and primary petrochemicals. Lippe began his professional career in 1974 with Diamond Shamrock Chemical Co., moved into professional consulting in 1979, and has served petroleum, midstream, and petrochemical industry clients since that time. He holds a BS (1974) in chemical engineering from Texas A&M University and an MBA (1981) from Houston Baptist University. He is an active member of the Gas Processors Association, serving on the NGL Market Information Committee and currently serves as chairman of the committee.
