Improved database management yields pipeline integrity benefits
Current industry trends in software design and careful examination of work patterns at pipeline operators have led to the development of new data management and analysis tools. These tools more effectively segregate the tasks of data management and data use, improving the speed, accuracy, and reliability with which pipeline operators can implement integrity management programs.
This article reviews a series of steps taken in pipeline data management to support both day-to-day and strategic integrity-management activities and provides examples of how new tools allow users throughout an organization to share, collaborate in the creation of, and analyze pipeline data stores.
A case study shows how streamlining data management allows operators to focus more of their energy on integrity management.
The problem
At the heart of a pipeline integrity management plan lies the need to bring together information from throughout the organization, see how various information pieces relate to each other, and act, based on patterns that emerge. This requires a thorough understanding of how the available data affect integrity, which in turn requires data to be integrated and aligned.
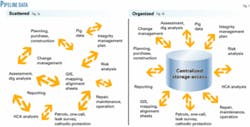
The often disparate nature of data and the various ways of gathering and reporting it can make aligning and integrating data difficult (Fig. 1a). A field report of a leak might give its location using GPS coordinates, while an in-line inspection may provide the location of pipe wall corrosion using an odometer reading. Landowner records may be sorted in sequence down the pipeline length, noting the tract length per parcel, while the latest close-interval survey of cathodic potential may record the number of readings at 2.5-ft spacings from the start of the survey. A series of points in a particular map projection may also provide location of the pipeline, with the as-built stationing recorded at each pipe bend.
Different data also are often located in different parts of an organization. The in-line inspection resides in an Excel spreadsheet on the corrosion engineer’s personal computer, the close-interval survey is in a series of text files on a compact from the surveyor, the leak survey is in a handwritten paper report that’s been scanned into a PDF file, and landowner records are in a small document management system built for the purpose several years earlier.
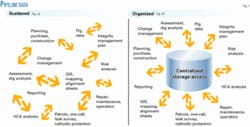
The operator needs to bring these data together in order to yield the proper integrity management conclusions (Fig. 1b). This involves, first, defining a place where data can be stored so that people know where to go for it and know how it is formatted, and second, establishing a common frame of reference to allow the location on the pipe of any information to be compared across the different data sets.
Data location
Methods available for data storage start with popular database software packages; Microsoft’s SQL Server and Oracle’s relational database platform being two of the most common. These provide the shell into which data can be loaded.
But for a database to be useful, the data need to be described, or formatted. Partnerships within the pipeline industry have developed several such formats. The Pipeline Open Data Standard is one of the most mature formats and describes a storage scheme for a wide range of pipeline data. Other data format standards tie into more specialized database systems such as those that focus on storing spatial data; e.g., ESRI Inc.’s ArcGIS Pipeline Data Model.
Many operators have also chosen to develop their own data formats, focusing on system performance or their own unique needs rather than on data interoperability, or the ability to share data between systems. The need rigorously to follow a standard format is decreasing as software becomes more flexible in reading different formats.
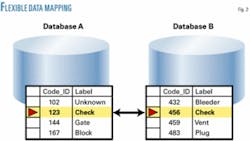
A data storage format, however, only addresses part of the storage problem. In addition to knowing the format in which data are stored, it is important to know how the format has been used. A database, for example might provide data about valves in a table, assigning each type of valve a number and storing it in a particular column. But a check valve might appear in one operator’s database as type “123” and in another operator’s as “456” (Fig. 2).
Data integration
The second part of the solution is aligning or integrating the data systematically. A geographic information system can accomplish this across disparate reference systems. A GIS combines a specialized database and analysis software. It is particularly beneficial for pipeliners wishing to integrate linear surveys and pipeline component data with the map data they may also have, a technique called “linear referencing.”
This technique allows the GIS to merge two common reference systems: the spatial world (GPS coordinates, latitude-longitude, and data in map projections) and the stationing or milepost world. Bringing datasets into one of these two reference systems will allow the GIS to complete the final step of bringing them all together.
GPS coordinates associated with a leak report and pipeline location in map projection coordinates are all spatial data. The GIS handles these easily and can integrate them on screen by displaying a map. Modern GIS applications can merge data in different map projections and rapidly display very large datasets through smart database techniques.
The linear distance down the pipeline, often called stationing, chainage, mileposts, stake numbers, or kilometer posts, is essentially a measurement system established when the pipeline was built and sometimes updated as changes to pipe configuration occurred. An in-line inspection odometer directly corresponds to the measurement system, and tools now exist that allow the in-line inspection odometer to be converted to the stationing system by aligning common features in the survey and the pipeline database.
The same concept applies to close-interval surveys, in which the distance walked can be converted to stationing. Any dataset that uses distance along a pipeline can be integrated by the measurement system into the GIS.
The final step brings data in the two frames of reference-spatial and stationing-together. GIS stores the spatial pipeline data and the stationing system, and the GIS can display data stored using stationing at a spatial location, bringing the stationed data onto the same map as the spatial data and integrating it.
A series of analysis tools looks for patterns and can, for example, establish that a leak location is coincident with corrosion predicted in the in-line inspection run, as well as a dip in readings during the close-interval survey.
Mapping the extent of each landowner agreement using the tract length can determine landownership.
Seeking patterns
Data evolve over time. After a number of years, the in-line inspection and close-interval survey cease to be current descriptions of the pipeline and need to be rerun. The pipeline location may change as the result of reroutes, and performing more accurate surveys may refine its location or that of its component features.
Comprehensive data management software packages exist that can combine the storage of a database with the integration capabilities of GIS and tools specific to the pipeline industry. A database alone is not enough. Users need tools to comprehensively manage the pipeline data.
But most GIS packages don’t have all the tools a pipeline operator needs to manage its data. An application that builds on database and GIS capabilities to provide workflows, such as survey data integration and pipeline configuration changes, is necessary. In partnership with the industry, a number of software companies have developed such applications, making the task of data maintenance smooth and reliable.
Comprehensively managing pipeline data is critical to the success of an integrity-management plan, ensuring users of reliable, current, and accurate data for their analyses without having to spend weeks hunting it down, and without being unsure of the format or quality.
Flexibility
Databases are not intuitive when used out-of-the-box and almost always require an additional software application. Users, accustomed to having data on their personal computers and within their control, also often feel a sense of detachment and a loss of control when data are centralized.
As systems become more flexible, however, they are moving away from applications bound so tightly to databases that the slightest change can render them inoperable. Instead, applications are becoming much more configurable to a range of different data formats. This is happening as software design heads in the direction of data format plug-ins and flexibility at its deepest levels and data modeling moves from strict standards to format guidelines and best practices.
A flexible application, instead of hard-coding itself to a particular table in a database, allows the user to pick the table and tell the application how data are stored. The pipeline company can then configure the database to suit all its needs, not just those of one application.
Applications have core needs, required to do their jobs. A mapping application needs some description of the pipeline location, for example. But storage of the underlying data should suit all the needs of the organization, not just one application. Inflexible applications require data to be duplicated, creating concerns about keeping different versions of data current and potentially making operational decisions based on outdated information.
Database
Users should not have to know or care about the databases behind the tools they use. The database should remain the domain of a select few, those who design and maintain them. Users manipulating in-line inspection data or planning a dig should not need to worry about the format of data or where it resides. They should, rather, simply be confident that data will be available when they need it, in the format they request, and that it will be protected from inappropriate changes.
Achieving this level of simplicity in the pipeline world requires application design that enables users to be task-focused and keep data behind the scenes.
Case study
A major North American natural gas transmission pipeline operator found itself with data-management problems when preparing for its annual pipeline risk assessments. Its 7,000-mile system generated a considerable amount of pipeline asset data, in addition to that created by surveys and analyses performed to maintain its integrity.
The operator’s annual assessment considers a variety of risk factors, including consequences of failure and threats that can influence the likelihood of failure. This process uses algorithms that weigh a range of different data sets against each other.
The problem for this specific company was not the algorithm; it was well developed and proven on small test datasets to yield an accurate relative risk score for any specific pipeline segment. The problem was processing 7,000 miles of pipeline data to suit the algorithm and get output useful to prioritizing maintenance and mitigation activities.
Data were spread over the entire company in a large number of formats. In some cases, data were being typed into a set of database screens for each of the 19,000 pipeline segments identified for analysis. The risk-assessment team had become experts in data manipulation and had constructed a complex web of preprocessing steps to get data into the proper format. This process took many months and required extensive documentation if each of the final datasets were to be related back to its source, a critical step in justifying the results of analysis.
A typical annual risk analysis therefore involved data processing by up to four team members lasting 9 months. Data loading took a database analyst several additional weeks and included even more manipulation of data to suit the algorithms.
The company began a data-integration initiative to bring together the asset and survey data sets being collected routinely across the pipeline system into a central data management system. The goals of the initiative were to:
- Make a permanent home for all data sets so users could find data that they needed.
- Standardize the data formats so that users always knew how to access the data.
- Manage updates to the data so that users could be assured they were working with the most up-to-date information.
- Properly handle changes to the data so that dependencies between different datasets were properly accounted for in the event of an edit or update.
These were company-wide goals, but without a configurable risk analysis application the benefits for the risk team would not reach their full potential.
The company used the data-integration initiative to revisit the risk analysis software and found that a configurable risk-analysis application was available and would lead to dramatic improvements.
The company’s first step was data integration, bringing disparate data from across the organization into a common aligned database. The balance of this article will focus on one of these data sets: in-line inspection data.
The operator used five separate survey vendors during the 5 years before the analysis, resulting in not only five different vendor formats, but also significant evolution in the data formats as inspection tool technology advanced. The inability of some vendors consistently to deliver in the agreed format also complicated the data.
The company wanted to load and align 56 individual in-line inspections into the corporate database. This process used template files to describe the different data formats by vendor and then vintage. Reusing these files to load the data significantly streamlined the process and brought the survey data into a single, consistent database format from which it could be aligned with the pipeline system, supplementing the odometer readings with actual pipe stationing.
Applications that stored quality indices within the resulting data documented the loading and alignment process.
Similar problems were experienced across most of the external data, including close-interval surveys, readings from test stations, and field inspections. A total of 25 new data types was introduced to the database, joining existing asset data.
Once the data were properly integrated in the shared pipeline database, the new risk application was able to read the data in the same format in which it was being stored within the data-management system, eliminating the need to consolidate and reformat the data, which previously took several months of work. The risk-analysis application also allowed the team to automate data preprocessing. These tasks having already been addressed, the company’s risk-analysis team simply needed to configure the application to read the data it wanted and then run the analysis.
The data-integration process also put responsibility for the quality of data where it belonged: with its owners. Since the members of the risk team were not corrosion experts or particularly knowledgeable about the status of specific pipeline locations, they had never been able to qualify the data they were using.
The new streamlined approach also increased the reliability of the analysis. Users could see how specific points in the original data affected the risk scores. Reports with drill-down capabilities connected summary results back to the original data, rather than to a preprocessed version of the data as had previously occurred. If a user wanted to see why a specific risk score came out the way it did, they could click down through the report to explore the exact data interactions that lead to the calculation.
The time needed to run an analysis also decreased significantly, allowing the risk analysis team to discuss any data quality concerns with those maintaining it, explore dependencies between datasets by performing multiple runs of the analysis, and generally focus on risk analysis rather than acting as data detectives.
The authors
Nick Park ([email protected]) is vice-president, product management, at GeoFields Inc., joining GeoFields as director of applied technology in April 2001. He also teaches a course on pipeline data management throughout the year. Prior to joining GeoFields, Park worked for ERDAS Inc. in a variety of management positions including product management. Park holds an MS in geographical information systems from the University of Leicester and a BS from the University of Leeds, both in the UK.
Christopher Sanders ([email protected]) is a senior product specialist at GeoFields Inc., with expertise in product management, GIS, and pipeline integrity regulations. He also provides training, quality assurance, and technical support for a range of software applications. Sanders has 6 years’ experience in the pipeline and GIS software industries. Prior to joining GeoFields, he was an acceptance testing engineer for Leica Geosystems and has also worked for the Northeast Georgia Regional Development Center as a GIS technician. Sanders holds a masters in forest resources and a graduate certificate in GIS from the University of Georgia.
Data control, key steps
- Bring survey data into a single, consistent database format where it can be aligned to the pipeline system.
- Automate data preprocessing for any type of analysis.
- Put responsibility for data quality with database managers, not users.
- Make sure reports connect summary results back to the original data.
- Use risk-analysis applications configurable to a range of data formats, avoiding data preprocessing and reformatting.


