Gulfstream Natural Gas System LLC gathered ROV and diver-collected data to determine the extent and severity of project construction effects on hard-live bottom areas within the trench corridor and associated spoil mounds and anchor strike-cable sweep locations. The data showed increased epifauna in these areas relative to reference locations.
Part 1 of this article (OGJ, Jan. 1, 2007, p. 58) detailed the methodology of Gulfstream’s monitoring activities. Part 2, presented here, discusses the results of its monitoring program. Subsequent parts will examine the use of the pipeline habitat replacement structures by fish and epifauna.
Transect analysis
Gulfstream randomly selected 45 frames from each transect video collected by ROV and 45 photographs from each diver-collected transect. Analysis of each for percent biotal cover by taxon followed the random point analysis described by Bohnsack. This analysis first scatters 100 random dots onto each transect image. Tabulating the percentage of dots touching organisms of each individual taxon then yields the percent biotal cover for a given taxon. Averaging data from individual images along each transect produces a mean for the entire transect.
Reference habitat transect data represented unaffected conditions for statistical comparison to trenched pipeline corridor and anchor strike transects.
Gulfstream calculated mean percent cover, epifaunal-epifloral count, species richness, and species diversity for each transect. Percent cover and epifaunal-epifloral count consisted of enumerating noncolonial sessile epifauna to the lowest possible taxonomic resolution.
Definitively assigning many organisms to a specific genus or species from the transect images proved difficult. These instances used a unique identifier for classification (e.g., orange sponge). An “unknown” category classified shadows or out-of-focus portions of individual frames. If a transect contained greater than 5% cover classified as unknown, it was excluded from analysis.
Statistical analysis
Calculation of diversity indices for each transect followed completion of summary data for each transect. Diversity indices calculated included number of species (s), Margalef’s species richness (d), Pielou’s evenness index (J), Shannon-Wiener (H¹), and Simpson (1-λ¹).
Margalef’s and Pielou’s bias tends toward rare species, while the Simpson index is considered biased toward dominant species. Shannon-Wiener is sensitive to rare species and regarded as the most balanced index of the four used in this analysis. Grouping some individual species into higher taxonomic levels during analysis produced conservative index results by reducing the number of taxonomic classes contributing to diversity.
A series of statistical tests compared data from the reference habitat transects to the impact areas and among depth zones. Two-way ANOVA tests address differences in abundance, percent cover, species richness, and diversity indices values by treatment and depth. Standard transformations, however, could not satisfy the assumptions of normality and heterogeneity of variances required by a two-way ANOVA.
Instead, performing either a one-way ANOVA or Kruskal-Wallis ANOVA on Ranks tests examined differences separately. If the one-way ANOVA test resulted in a significant p-value, a Student-Newman-Keuls (SNK) multiple comparisons test was performed (α = 0.05). Instances when only two treatments were compared used either a parametric T-test or nonparametric Mann-Whitney U-test.
Analysis of Similarities (ANOSIM), a PRIMER v5 multivariate analysis technique assessed any differences in the community assemblage between areas and depth zones. If ANOSIM results indicated a significant difference among groups, a Similarity Percentages (SIMPER) analysis (another PRIMER v5 multivariate analysis technique) determined which groups were most influential in creating the differences.
The SIMPER technique examines both the average similarity within groups and the average dissimilarity between groups. The dominance of turf algae required the data to be double root transformed to increase the importance of rare species prior to ANOSIM and SIMPER analysis. Bray-Curtis similarity matrices were used as recommended by Clarke and Warwick.
Results
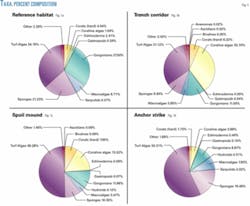
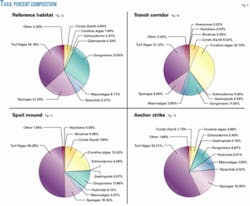
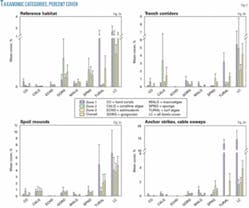
Epifaunal-epifloral percent cover was relatively low in the reference habitat, averaging less than 2%. Turf algae, gorgonians, and sponges dominated. Other relatively abundant taxa included hard corals, coralline algae, echinoderms, and macroalgae (Figs. 1a and 2a).
Analysis of all transect types included echinoderms, which are not sessile epifauna but are linked to hard-live bottom substrate for both feeding and shelter, due to their abundance and strong ties to habitat structure. Gulfstream identified Cladocora-Oculina (Coral) and Pterogorgia (Gorgonian) in affected transects but not in reference habitat transects.
Tables 1-3 summarize results of the analyses of the live bottom community at the unaffected reference habitat. Table 1 also compares the reference habitat results with data collected along similar transects before construction and reported during the permitting phase of the project. Preconstruction transects contained a higher epifauna percent coverage in each Depth Zone in comparison to the 2005 reference habitat transects. A 2005 red tide likely caused the lower epifaunal-epifloral percent cover in the 2005 reference habitat transects. The red tide affected Depth Zone 1 and a portion of Depth Zone 2 before transect data were collected.
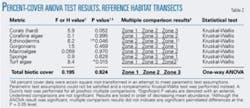
The federal mitigation plan considered depth as a potential influence on live bottom recruitment due to biological community characteristics observed during preconstruction surveys. Results of the 2005 monitoring effort indicate that a significant difference in percent cover based upon Depth Zone was not found and there was no difference with depth in the cover of the dominant taxonomic categories within reference habitat transects (Table 2).
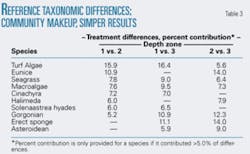
Taxonomic diversity based upon standard indices also did not differ between Depth Zones. ANOSIM results, however, indicated a significant difference in community structure. SIMPER results indicate the community differences related predominantly to the presence of turf algae, sponges, and gorgonians (Table 3).
Trenched corridor
Gulfstream established ten 25-m random transects within both the trench corridor and trench spoil mounds perpendicular to the pipeline in Depth Zones 1, 2, and 3. Analysis of trench corridor transects included percent biotal cover, species richness, and species diversity when compared to reference habitat results.
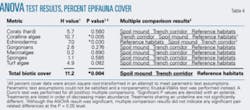
The trench corridor had a significantly higher proportion of biotic cover than the reference habitat, with biotic cover in the trench corridor of nearly 6% (Table 4). Turf algae, gorgonians, and sponges dominated the trench corridor, with a large percentage of coralline algae observed (Figs. 1b and 2b), similar to the reference habitat.
The high degree of variability limited differences between trench corridor and reference habitat transects in percent cover for individual taxonomic categories (Table 4). Taxonomic diversity was similarly limited between the trench corridor and reference habitat. ANOSIM results indicated a significant difference in community structure between the trench corridor and reference habitat transects.
Gulfstream also analyzed hard-live bottom recovery by depth. The amount of biotic cover decreased with depth along the trench corridor, but the trend was not statistically significant.
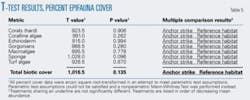
Trench spoil mound transects were also analyzed for percent biotal cover, species richness, and species diversity, and compared to reference habitat results. The spoil mounds showed a similarly significantly higher proportion of biotic cover than the reference habitat; more than 7% (Table 5). The trench corridor had a smaller mean biotic cover than the spoil mounds, but the difference was not significant.
Turf algae, gorgonians, and sponges (Figs. 1c and 2c) dominated the spoil mound transects. Turf algae represented about 50% of the fauna present. Analysis did not find a significant difference in the percent cover of individual taxonomic categories (Table 5).
Taxonomic diversity on the spoil mounds did not differ significantly from either the trench corridor or reference habitat. ANOSIM results also failed to show a significant difference in community structure between the spoil mounds and reference habitat or trench corridor. Analysis of hard-live bottom recovery showed less biotic cover with depth in spoil mound transects, but the trend was not statistically significant.
Anchor-cable transects
Analysis of anchor strike and cable sweep transect images looked for percent biotal cover, species richness, and species diversity, before statistically comparing them to the reference habitat (Figs. 1d and 2d).
The proportion of biotic cover showed no significant difference between the anchor strike-cable sweep and reference habitat transects (Table 5). Visible anchor strikes, however, held a higher proportion of biotic cover (Mann-Whitney, T = 346.0, P = 0.001*) within the strikes themselves (mean of 9.5 ±2.3%) than in the reference habitat (mean of 1.1 ±0.4%).
Gulfstream expected that anchor strikes and cable sweeps would increase the amount of bare rock by scraping away the surface sediment veneer. The percent cover of bare rock the company identified in the anchor strike-cable sweep transects, however, was only slightly greater (and not significantly different) than that found in reference habitat transects.
Comparing bare rock cover by depth, Zone 1 exhibited a significantly higher amount of exposed rock than Zone 2. Performing a separate analysis examining only areas that showed visible signs of anchor impact identified a significantly greater percent cover of bare rock (Mann-Whitney, T = 354.0, P = 0.001*, mean of 11.3 ±2.7%) than the reference habitat (mean of 4.0 ±2.9%).
Biological assessment
Undisturbed hard-live bottom reference habitat areas contained very little biotic cover (<2%) with a predominantly sand veneer substrate. Dominant sessile epifauna included turf algae, gorgonians, and sponges. The red tide that preceded 2005 monitoring led to expectations of diminished biotic cover in Depth Zones 1 and 2.
The community structure differs between Depth Zones within reference habitat areas; diversity based upon standard index values does not, however. Turf algae dominate in the shallower depths, while sponge and gorgonian cover increases with depth. The communities established on exposed rock proved susceptible to either burial or scouring on a regular basis via sand movement.
Hard-live bottom communities on the west Florida shelf, therefore, are not static-state growth communities but instead are dynamic communities frequently disturbed by natural events such as red tide and storms.
The federal mitigation plan stated a measure of 80% similarity for the environment to be considered recovered. It did not state, however, if this required 80% similarity in percent cover or in species composition.
Gulfstream activities appear to have met both criteria, as biotic cover was enhanced in the trench corridor, spoil mound, and visible anchor strike areas compared to natural undisturbed hard-live bottom. An increased amount of bare substrate for epifaunal-epifloral recruitment likely caused the increase in cover.
The enhanced recruitment and greater diversity of fauna found in the areas of the pipeline, however, did not significantly alter the community structure from that found on undisturbed bottom. Rock exposed during trenching and anchoring activities allows for attachment sites in an otherwise predominately sand veneer matrix.
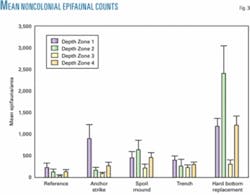
These results are based solely on percent-cover information. Noncolonial epifauna were also counted along each transect. Analysis found similar trends in abundance when examining these counts (Fig. 3).
