Study tests accuracy of methods that estimate hydrate formation
Because inhibitors are important in reducing formation of hydrates in gas streams, we performed a study to investigate and evaluate the accuracy of available tools that predict hydrate formation conditions in the presence of inhibitors.
We evaluated two commercial process-simulation programs and three shortcut methods. The study covered wide ranges of pressures and inhibitor concentrations.
Required model parameters for one of the shortcut methods are reported for the first time.
In general, engineers should check the process simulator results against experimental data before using the simulator for an actual process. All three shortcut methods studied were accurate down to 20° F.; below that temperature, the Moshfeghian-Maddox method is most accurate but requires more calculations.
Hydrate inhibitors
Inhibitor injection is one of the practical means for preventing hydrates from forming in process equipment and natural-gas transportation pipelines. Accurate knowledge of hydrate formation conditions in the presence of inhibitors is therefore very useful for safety and economic reasons.
Many materials when added to water will depress the hydrate and freezing temperatures. For many practical reasons, alcohol or a glycol-usually methanol, diethylene glycol (DEG), or monoethylene glycol (MEG)-is used as an inhibitor. All can be recovered and recirculated in a process, but recovering methanol may not be economic in many cases.
The total injection rate is the amount of inhibitor needed in the liquid water plus inhibitor that enters the vapor and hydrocarbon liquid phases. Any inhibitor in the vapor or liquid hydrocarbon phase has little effect on hydrate formation conditions.
Determining the amount and concentration of inhibitors and their distribution in different phases is important for practical purposes. Determining the required amount and concentration of these inhibitors is possible with several thermodynamic models for hand and rigorous calculations that have been developed and incorporated into software programs.
This study evaluated the accuracy of two commercial process simulators-ProMax1 and HYSYS.2 Three shortcut methods can be used to calculate the required concentration of inhibitor and the injection rate for dewpoint correction, NGL recovery, or pipeline transportation of natural gas. The calculation procedure is shown in Chapter 6 of “Gas Conditioning and Processing,” Vol. 1.3 The three methods we evaluated are those developed by Hammerschmidt,4 Nielsen-Bucklin,5 and Moshfeghian-Maddox (OGJ, Aug. 30, 1993, p. 78).
The study examined multicomponent natural gas mixtures over a wide pressure range, up to 100 MPa, and identified the strengths and limitations of these methods.
Computer simulators
Various literature sources report hydrate formation pressure and temperature conditions.6-9 Reported experimental data include pressure, temperature, dry gas composition, and concentration of inhibitor in water solution mixed with the hydrate former. Overall compositions are not provided.
In some reports, overall composition can be approximately inferred by the phase equilibrium data presented, but McIntyre10 disputes that these data do not extend to the higher inhibitor concentrations presented, the region where they are most needed.
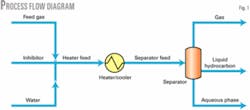
Fig. 1 shows the process flow diagram used in this study to simulate the experimental measurements. Feed gas, inhibitor, and water are mixed at the mixer. All three streams are at the same pressure and temperature.
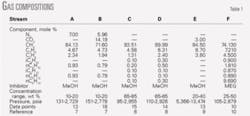
Table 1 shows different feed-gas compositions. The inhibitor stream is either pure methanol or MEG, and the water stream is pure water. The water-stream flow rate was set to a small flow rate for the resulting aqueous phase. We adjusted the inhibitor-stream flow rate to produce the specified weight percent of inhibitor in the aqueous phase.
Mixing effects will change the temperature; we therefore added a heater-cooler with no pressure drop to readjust the mixed separator feed stream temperature to the experimental hydrate formation temperature value.
This process flow diagram ensures that the condition of hydrate-formation temperature in the three-phase separator is close to those measured experimentally. We therefore used it in both commercial process simulators.
Overall effects
To investigate the impact of overall composition (which was unknown) on hydrate formation temperature, we adjusted the water rate, CO2 concentration, and heavy ends.
Water rate
For 100 mole/hr of Gas E in the presence of 40 wt % methanol, we varied the water rate from 1-10 mole/hr and predicted hydrate-formation temperatures using the two simulators. For each water flow rate, we adjusted the inhibitor stream rate to produce the specified inhibitor concentration of 40 wt % methanol.
Hydrate-formation temperature is independent of the water rate in both simulators. In subsequent runs, we set the water-stream rate to 10 mole/hr for 100 mole/hr of gas.
CO2 composition
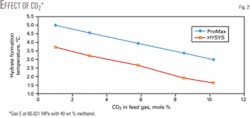
The reported composition of CO2 in Gas E was 3 mole %; we therefore varied the CO2 concentration in our study from 0.1 to more than 10 mole %. For each mole % of CO2, the gas mixture was normalized, but other conditions remained the same as the reported experimental values.
Fig. 2 shows that, even though CO2 concentration varied more than 100-fold, the variation of predicted hydrate-formation temperatures in the presence of 40 wt % methanol is less than 2º C.
Heavy ends
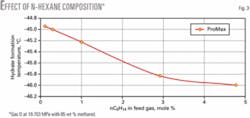
We conducted a similar study for Gas D in the presence of 85 wt % methanol in which the nC6H14 composition in the feed gas was varied from 0.1-4.8 mole %. This change in nC6H14 corresponds to a change in the methane composition from 90.17 to 85.95 mole %. The reported composition of nC6H14 was 0.3 mole % and that of methane was 89.99 mole %.
Changing the nC6H14 composition by a factor of 50, and consequently changing the overall composition, the hydrate formation temperature changed only 1.2° C. with ProMax. HYSYS could not converge for this test run.
Fig. 3 shows these results.
Even though overall composition is important, Figs. 2 and 3 show that variation of overall composition has only a slight effect on the predicted hydrate temperature and the error is within ±2° C. This magnitude of error is normally within the experimental error and is not in agreement with McIntyre’s remark that “predictions of hydrate formation conditions in process simulators is difficult to verify in cases where the mutual solubility of the hydrate former and inhibitor is relatively high.”10
The authors also warn that, “without knowledge of the overall composition, a significantly wide range of predicted conditions is possible. More significantly, depending on the nature of the system, therefore they suggest that caution must be exercised when using these experimental data for design or other use since the reported conditions are for an unknown overall composition.”
Evaluation results
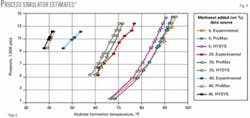
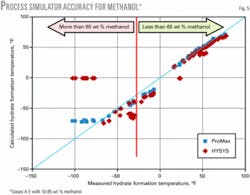
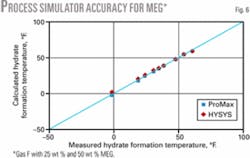
Table 1 shows the composition, inhibitor range, pressure range, number of data points, and the reference of the experimental data for the gas mixtures studied. Fig. 4 shows the ability of ProMax and HYSYS to predict the hydrate-formation temperature for Gas E. Figs. 5 and 6 show the accuracy of these software products for the mixtures in Table 1.
null
null
Figs. 5 and 6 indicate that for methanol inhibition, the lower limits of hydrate formation temperatures are -75° F. (-60° C.) for ProMax (maximum of 70 wt % methanol) and -25° F. (-32° C.) for HYSYS (maximum of 50 wt % methanol). HYSYS could not converge for cases of 85 wt % methanol. For MEG, both simulators give accurate results down to 0° F. (-18° C.) corresponding to 50 wt % MEG.
Shortcut methods
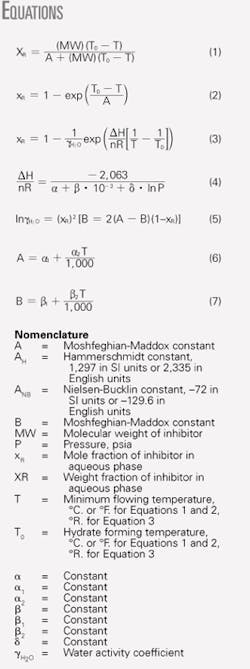
Three shortcut methods were evaluated in this study (see equation box)-those developed by Hammerschmidt, Nielsen-Bucklin, and Moshfeghian-Maddox.
Hammerschmidt4 was the first to present a correlation for calculation of the required mass fraction of inhibitor in the aqueous phase. Equation 1 shows the widely used correlation of Hammerschmidt.
Nielsen and Bucklin proposed a more accurate correlation,5 shown in Equation 2.
To predict inhibition effects accurately for pressures as high as 14,500 psia (100 MPa) and higher concentrations of methanol and MEG, Moshfeghian and Maddox suggested a correlation, shown in Equation 3.
They proposed correlations for the enthalpy of formation-hydrate number (Equation 4) and used a temperature-dependent Margules model for water activity coefficient (Equation 5).
Equations 6 and 7 define the temperature-dependent parameters.
Unfortunately, parameters for this model were not previously published. In this study, Table 2 shows the required parameters for Equations 4-7; these are released for the first time.
The required hydrate-formation temperatures in the absence of inhibitor (pure water) were predicted by the Parish and Prausnitz11 model for all three inhibition shortcut methods. This ensured the same basis and accurate results.
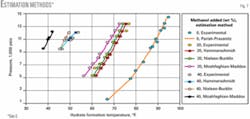
Fig. 7 shows that the Parish-Prausnitz method predicts the hydrate-formation temperature for Gas E in the absence of inhibitor (0 methanol) accurately. This method was used to add its prediction temperature to the depression temperature predicted by the three shortcut methods for the sake of easy comparison with the experimental data.
Fig. 7 also indicates that all three methods give good results for 20 wt % methanol; however, for 40 wt % methanol, the Hammerschmidt results deviate from the experimental data considerably.
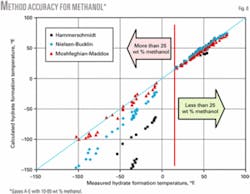
Fig. 8 shows that all three methods give accurate results for temperatures as low as 20º F. (-6.7º C.) equivalent to maximum of 25 wt % methanol. At lower temperatures (or higher methanol concentrations) the Hammerschmidt method deviates from the experimental data considerably. For lower temperatures, the Moshfeghian-Maddox gives better results than the Nielsen-Bucklin method.
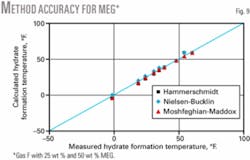
Fig. 9 shows that all three methods give accurate results for Gas F up to a concentration of 50 wt % MEG (as low as 0º F.) for which experimental data were available.
Findings
Based on our study, we concluded that:
- The accuracy of a process simulator should be checked before its application for an actual process.
- For methanol, the lower limits of hydrate formation temperatures are -75° F. (-60° C.) for ProMax (corresponding to a maximum of 70 wt % methanol) and -25° F. (-32° C.) for HYSYS (corresponding to a maximum of 50 wt % methanol).
- For MEG, both ProMax and HYSYS give accurate results down to 0° F., which corresponds to 50 wt % MEG.
- All three shortcut methods give accurate results for temperatures as low as 20° F. (-6.7° C.), which corresponds to a maximum of 25 wt % methanol. At lower temperatures (or higher methanol concentrations) the Hammerschmidt method deviates from the experimental data considerably. For lower temperatures, the Moshfeghian-Maddox method gives better results than the Nielsen-Bucklin method.
- All three shortcut methods give accurate results for Gas F up to a concentration of 50 wt % MEG (as low as 0° F.), for which experimental data were available.
References
- ProMax, version 1.2, Bryan Research & Engineering Inc, Bryan, Tex., 2005.
- HYSYS, version 3.2, Build 5029, Aspen Technology Inc., Cambridge, Mass., 2003.
- Campbell, J.M., “Gas Conditioning and Processing, Vol. 1, the Basic Principles,” 8th Ed., Norman, Okla.: J.M. Campbell & Co., 2001.
- Hammerschmidt, E.G., “Formation of gas hydrates in natural gas transmission lines,” Ind. & Eng. Chem, Vol. 26 (1934), p. 851.
- Nielsen, R.B., and Bucklin, R.W., “Why not use methanol for hydrate control,” Hydrocarbon Processing, Vol. 62, No. 4, April 1983, p. 71.
- Ng, H.J., and Robinson, D.B., “Research Report RR-66,” Tulsa: Gas Processors Association, 1983.
- Ng, H.J., Chen, C.J., and Robinson, D.B., “Research Report RR-106,” Tulsa: Gas Processors Association, 1987.
- Blanc, C., and Tournier-Lasserve, J., “Controlling hydrates in high-pressure flowlines,” World Oil, November 1990.
- Ng, H.-J., Chen, C.J., and Robinson, D.B., “Research Report RR-92,” Tulsa: Gas Processors Association, 1985.
- McIntyre, G., Hlavinka, M., and Hernandez, V., “Hydrate Inhibition with Methanol-A Review and New Concerns over Experimental Data Presentation,” presented at the 83rd Annual GPA Convention, New Orleans, Mar. 14-17, 2004.
- Parrish, W.R., and Prausnitz, J.M, “Dissociation Pressures of Gas Hydrates Formed by Gas Mixtures,” Ind. Eng. Chem. Proc. Dev., Vol. 11 (1972), No. 1, pp. 26-35.
Based on a presentation to the 22nd European Symposium on Applied Thermodynamics, June 28-July 1, 2006, Elsinore, Denmark.
The authors
Mahmood Moshfeghian ([email protected]) is a senior research engineer at John M. Campbell & Co., Norman, Okla. Before joining JMC, he was professor of chemical engineering at Shiraz University, Iran, where he served as department head and associate dean of research in the college of engineering. He was previously professor of chemical engineering at the University of Qatar and a senior research scientist at the Kuwait Institute for Scientific Research. Moshfeghian holds BS, MS, and PhD degrees in chemical engineering from Oklahoma State University. He is a member of AICHE.
John C. Bourdon is vice-president of the John M. Campbell & Co. He has more than 30 years’ experience in hydrocarbon processing. Bourdon is a Campbell gas instructor for “Gas Conditioning and Processing” and consultant specializing in sour gas processing. He has been involved in the development of several sulfur-related technologies and mechanical innovations. Bourdon holds a BS in chemical engineering from the Georgia Institute of Technology and advanced degrees in other fields. He is a registered Professional Engineer and member of AIChE, SPE, and Chi Epsilon Sigma Honor Society.
Robert N. Maddox (rmaddox @okstate.edu) is the Sheerar Chair emeritus professor of chemical engineering at Oklahoma State University. He served as head of the chemical engineering department from 1958 to 1978. He is a fellow of AIChE and a member of GPA.

