Study outlines European refinery demand to 2015
A recent study of the European refining industry from Concawe (Conservation of Clean Air and Water in Europe) concludes that the imbalance between demand for gasoline and middle distillates will continue to increase. The study, “Oil refining in the EU in 2015,” developed base case, low-demand, and other plausible supply-demand scenarios to evaluate possible consequences in terms of investment requirements, total economic impact, energy consumption, and CO2 emissions.
From a reference 2015 scenario, Concawe explored different sensitivities, which included such factors as the dieselization rate of EU’s car population, improved vehicle efficiency, effects of nontechnical measures to reduce demand, introduction of biofuels, and availability of gasoline export markets and gas oil/diesel import sources.
The study’s main conclusions are:
- Adequate crude distillation capacity exists in Europe to meet forecast demand by 2015. Refiners there, however, must add downstream units and operate others differently to cope with changes in the product slate, especially regarding middle distillates and gasoline.
- The gas-oil-to-gasoline (GO/G) ratio is the most important parameter that determines the processing configuration that will be needed. This ratio, according to Concawe, can change due to many factors including dieselization, relative penetration of alternative fuels, and continued availability of gasoline export markets and middle distillate imports.
- Refinery investments are mainly required in hydrocracking and some residue desulfurization or conversion capacity.
- A continued increase in the GO/G ratio would present serious difficulties for EU refiners in terms of adapting their refineries for the right processes and the magnitude of required investments.
- A possible increase in overall CO2 emissions due to an excessive rate of dieselization and a decrease in the efficiency gas between diesel and gasoline cars.
EU refinery model
The Concawe study used a linear programming technique to simulate the European refining system. The EU, plus Norway and Switzerland, was divided into eight regions: Baltic, Benelux, Germany, Central Europe, UK and Ireland, France, Iberia, and Mediterranean. In each region, the actual refining capacity was aggregated for each process unit into a single notional refinery.
Six model crudes represented crude feeds to the region’s refineries. Specific other feedstocks could also be included in the model.
The model was first calibrated with real data from the 2005 base year. The 2015 scenarios were then run as independent cases.
As a rule, Concawe required the model to produce the stipulated demand from a given crude slate; the main flexibilities were crude allocated to each region, intermediate and finished product exchanges, and mainly investment in new process units. The crude diet was the same in all cases (45% light low sulfur, 55% heavy high sulfur) with only one crude (heavy Middle East) allowed to vary.
Crude supply
In the past 2-3 decades, the favorable geographic location of Europe in relation to light and sweet crude-producing regions has resulted in a fairly light crude diet, according to the study.
In 2005, the 27 countries included in the study consumed about 735 million tonnes of crude as feedstocks. This will grow to 785 million tonnes by 2015, according to Concawe.
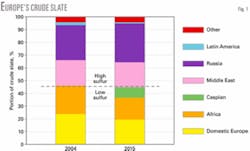
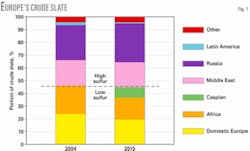
Supplies will be adequate for this demand, but supply sources will change. North Sea production will decline but other regions like West Africa and Caspian basin will take over. This change will not significantly affect overall quality; the study predicts that Europe will be able to maintain its current proportion of 45% sweet crude feed (Fig. 1).
Product demand
Europe, in the past few years, has seen two main trends affecting product demand from its refineries:
- Lighter products. Europe is demanding more gas oils and lighter products, and less residual fuel oils. This is due to development of land and air transport as well as demand for petrochemical feedstocks.
- Dieselization. Europe has a fast-growing market for diesel and jet fuel, and eroding demand for gasoline. Although present in other regions of the world, this trend is particularly strong in Europe.
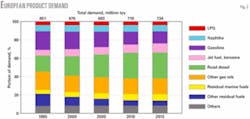
Fig. 2 shows historical demand for various refinery products and the forecast to 2015. It shows the further lightening of the demand barrel. The widening imbalance between middle distillates (gas oils, kerosine, jet fuel) and gasoline is also obvious; a marked decrease of gasoline demand and large increases of diesel and jet fuel demands only slightly tempered by a slow decline of other gas oils (mostly heating oil).
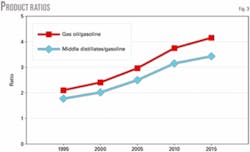
Fig. 3 shows imbalances in the GO/G ratio and middle-distillate-to-gasoline ratio. In this study, gas oils include automotive, marine, and off-road diesel, heating gas oils, and industrial gas oils. Middle distillates also includes jet fuel and kerosine.
Fig. 3 shows that the GO/G ratio has increased 50% since 1995 and will increase another 50% by 2015.
Refinery requirements
To study refinery requirements, Concawe first forecast total market demand and then made assumptions of the proportion of that demand that EU refineries will have to meet. There are two main sources of discrepancy between demand and refinery requirements.
The first source is trade. The imbalance between middle distillates and gasolines has made it virtually impossible to meet these two demands simultaneously without reverting to trade, according to the study. European refiners have been able to balance demand and supply by exporting surpluses of gasoline (mostly to the US) and importing gas oils and jet fuel (from Russia and the Middle East). European refiners depend heavily on the continued availability of these export markets and import sources.
Based on the most recent International Energy Agency final statistics (2003), Concawe assumed 2005 trade flows were:
- 28 million tonnes/year (tpy) of middle distillate imports (10 million tpy of finished road diesel, 10 million tpy of heating oil, and 8 million tpy of jet fuel).
- 22 million tpy of gasoline exports. The 2003 gasoline export figure was lower, but, in view of the fast reducing gasoline market Concawe assumed the 2005 figures would be higher.
In the reference scenario, the study assumed that these current trade levels are carried forward into the future.
The second source of discrepancy between demand and refinery requirements is the substitution of refined products by alternative fuels. The study’s reference scenario does not include any provision of biofuels or other alternatives.
Factors affecting demand
The study found that many factors affect refined product demand:
- Automobile fuel efficiency.
- Dieselization.
- Other technical and nontechnical measures to reduce transportation demand or improve efficiency.
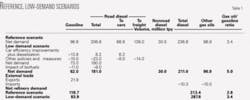
All these factors will likely lead to less, rather than more, demand for refinery investments; therefore, Concawe developed a low-fuel-demand scenario based on an analysis of plausible evolution of these factors (Table 1).
Currently, every other car sold in the EU has a diesel engine; diesel cars represent about 30% of the total fleet. If diesel vehicle sales remain at their current level, its share will increase to more than 40% in 2015.
The study’s reference scenario assumes about 35% diesel cars in the fleet by 2015, which implies a reduction of the fraction of new sales. There is, therefore, considerable scope for scenarios that foresee higher diesel penetration.
For the low-demand scenario, Concawe assumed diesel sales increasing to 60% of all new cars by 2015. This roughly corresponds to a shift of 8 million tpy of refined product demand from gasoline to diesel. For the extreme scenarios, the study considered a maximum of 75% diesel sales in 2020.
It is of course also plausible to envision a reversal of the trend towards diesel cars. Concawe therefore considered an extreme case in which diesel sales would slump to 20% of the total by 2015 and stay constant thereafter.
Technical measures include efficiency improvements of other road vehicles (particularly trucks), low-friction lubricants, low-friction tires, driver feedback systems, and improved traffic-flow management.
Nontechnical measures include taxation, eco-driving (with voluntary or mandatory training), energy labeling, speed limits, etc.
Investment requirements
In the study’s low-demand scenario, curtailment of the road-fuel market leads to less total product demand by 2015. In this scenario, Europe will not require new crude distillation capacity; any marginal increases will be due to minor revamps of existing units and capacity creep.
Relative demand for refined products will, however, evolve markedly. This study focuses on the possible evolution of transportation fuel demand and, more specifically, to how much EU refineries will have to produce, including the share of biofuels and the scope of external trade.
These changes in the demand barrel will require refiners to adapt their plants to make these products from available crude oil supplies. In practice, this means modified and new plants and, therefore, investments. Within the highly complex and flexible EU refining system, supply-demand constraints can also be alleviated, at a cost, by intra-European trade of either finished products or intermediate streams.
Although Concawe does constrain the internal trade opportunities to what appears feasible logistically, the modeling represents an economic optimization of the system’s capabilities.
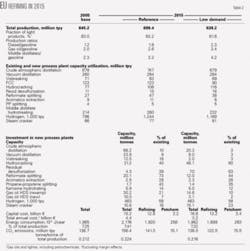
Table 2 summarizes the changes to the EU refining system required by 2015 for both the reference and low-demand scenarios.
Reference scenario
Total production increases 8.5% in the reference scenario. This will require more distillation capacity, although this level of increase is attainable via capacity creep through minor revamps rather than new units or grassroots refineries.
The fraction of light products in the total product slate (which characterizes conversion intensity) only increases marginally; demand for residual does decrease, but current residual fuel oil imports (around 10 million tpy) are assumed to cease by 2015.
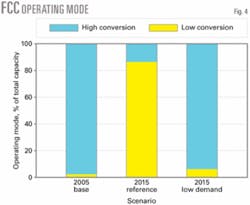
Production of an additional 47 million tpy of distillates requires, however, new conversion capacity. Because the bulk of the increase is in the form of diesel and jet fuel, hydrocracking is the preferred route. The model also seeks to maximize the economic use of existing assets. FCCs are still fully used, but their operating mode changes (Fig. 4).
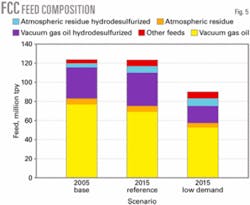
In the 2005 base case, almost all FCC capacity operates as high-conversion units, thereby maximizing the yield of gasoline components and minimizing the yield of low-quality diesel components. In the 2015 reference scenario, FCCs operate as low-conversion units. Light cycle oil quality improves, partly due to use of hydrotreated feedstocks from dedicated feed hydrotreaters, mild hydrocrackers, and residue desulfurizers (Fig. 5) but also by deep hydrodesulfurization.
Additional deep gas-oil hydrodesulfurization is also required to make sulfur-free road diesel. There is of course a concurrent need for extra hydrogen production.
A significant increase of reformate splitting is required to rebalance the various quality requirements of the gasoline pool.
According to the study, any additional steam cracker capacity is broadly in line with increased ethylene demand. The larger increase in demand for higher olefins and aromatics is partially met in refineries that will invest in propane-propylene splitter and aromatic extraction plants. Steam-cracker feed composition only marginally changes.
The resulting capital investment cost is €15.2 billion (€4.4 billion/year), which includes capital charges, extra fixed and variable costs, and extra fuel and loss. All these additional plants consume energy and energy consumption of the refineries goes up in absolute terms, as do CO2 emissions.
Energy consumption and CO2 emissions also increase relative to the total production. Because the depth of conversion does not significantly change, this is clearly the result of a higher GO/G ratio.
Low-demand scenario
Reduced transportation-fuel demand results in a slight contraction of the total refinery output, according to the study’s low-demand scenario. Because the study assumes that demand for all other products is constant, the conversion intensity is lowered.
The middle distillate/gasoline ratio is, however, nearly double compared to the 2005 base case. Refiners can only achieve this level of production via a much larger shift from FCC to hydrocracking capacity. Utilization of existing FCCs is much lower (72% of available capacity), whereas investment in new hydrocracking and residue desulfurization capacity is 50% higher than in the reference scenario despite reduced conversion intensity.
The mechanisms used by the model to rebalance the gasoline pool are complex.
In this scenario, FCCs operate in high-conversion mode (Fig. 4) and more desulfurized residue is used as FCC feed (Fig. 5), replacing desulfurized vacuum gas oil used as hydrocracker feed.
The steam-cracker feed diet changes significantly; more heavy naphtha is used because less gasoline, no hydrowax, and less LPG is produced in refineries due to lower FCC runs. The average ethylene yield decreases compared to the base case, which explains the additional increase in steam cracker feed capacity compared to the reference scenario.
For energy consumption and CO2 emissions, both effects compensate each other so that the figures are similar to the study’s 2005 base case.
Sensitivity to GO/G ratio
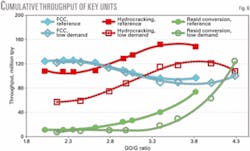
Fig. 6 shows the changes in the cumulative throughputs of key process plants. Similar to what was observed in the comparison between the reference and low-demand scenarios, FCC utilization decreases with increasing GO/G ratio. Concurrently, new hydrocracking and residue desulfurization capacity becomes important. At very high ratios, hydrocracking cannot be further increased due to a lack of feedstock and massive residue desulfurization capacity is the only solution. FCC throughput recovers somewhat because more desulfurized residue feedstock becomes available.
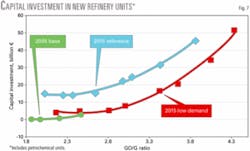
The large investment cost required to install additional unit capacity correlates remarkably well with the GO/G ratio for a given level of demand (Fig. 7). Both curves follow the same trend. The reference scenario requires €15.2 billion of investment (from the 2005 base case) and increasing the GO/G ratio from 2.6 to 3.4 virtually doubles this cost.
Fig. 7 shows a shallow minimum towards the lower range of GO/G ratios. This suggests there may be an optimum ratio value, as a function of the demand level, where demand can be met at lowest investment cost.
