This is the second of three parts on insurance loss statistics and their role in risk management in offshore exploration and development operations.
Part 2 is a summary of the scale of insured loss in the offshore energy industry by cause, category, and region using the Willis Energy Loss database.
Energy loss statistics play an important role in calibrating and verifying risk management software and are useful to gauge the state of the insurance market.
Risk events associated with offshore energy exploration and production occur infrequently but have the potential of generating large losses. Blowouts, design/workmanship, heavy weather, and fire/lightning/explosion represent the largest loss categories for offshore basins across the world.
Introduction
Offshore oil and gas production takes place in a confined space in a hostile and uncertain environment under the constant danger of catastrophe and loss.
Drilling, processing, construction, installation, and transportation activities involve significant financial and safety risks. It is possible to engineer some risks to a low threshold of probability, but losses and unforeseen events cannot be eliminated because of cost considerations, the human factor, and environmental forces.
Design standards have improved over the years with stricter regulatory requirements and improvements in technology, but with the increased value at risk, loss statistics have also grown.
Data source
The Willis Energy Loss database is a compilation of offshore loss claims across each segment of the energy supply chain.
The database contains records beginning from the early 1970s covering nine regions of the world for insured losses greater than $1 million/occurrence. The manner in which data are aggregated and classified is determined in part by the manner in which claims reports are collected and user preference.
Categories reflect a limited number of causal choices but can also be misleading, since damage can occur in many forms and failures are often due to a combination of conditions.
Total offshore losses
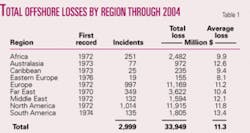
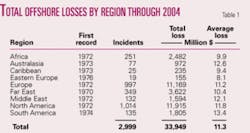
For each offshore region of the world, overall losses are tabulated in terms of their inflation-adjusted total loss and average indexed loss (Table 1).
North America, Europe, and the Far East have the greatest number of incidents and offshore losses in the world, contributing roughly 80% of the total $34 billion reported loss.
The number of incidents is a useful measure to gauge the frequency of events and the relative size of each data category. On an aggregate basis, the average loss across all cause and loss categories are roughly comparable, ranging from $8.1 million (Eastern Europe) to $13.4 million (South America).
Incidents by loss category
Platforms ($13.4 billion), rigs ($7.1 billion), wells ($5.7 billion), and pipelines ($3.9 billion) dominate the total loss category and contribute more than 80% of the total loss (Table 2).
Average platform ($16.3 million) and rig ($15.1 million) loss are more significant than the average well ($9.9 million) and pipeline ($6.1 million) damage.
Incidents by cause
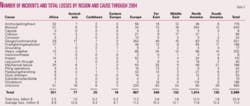
With respect to the number of incidents and total losses by region and cause, categories with less than five total events are omitted here (Table 3).
The number of losses due to unknown causes is relatively small for North America (83 incidents, $413 million total loss, $5 million average loss) and the Far East (61 incidents, $261 million total loss, $4.3 million average loss), but significantly larger for Europe (222 incidents, $1.743 billion total loss, $7.9 million average loss).
Losses by loss category
The magnitude of losses provides an indication of the absolute losses, but for comparative analysis, the average loss is a more useful statistic (Tables 4 and 5).
South America, for example, exhibits the greatest average platform loss ($28.3 million), followed by Australasia ($20.3 million), North America ($17.9 million), Africa ($17.3 million), and Europe ($16.2 million). Regions such as the Caribbean and the Far East have low average platform losses.
null
Losses by cause
Offshore losses by cause for North America, Europe, and the Far East represent 80% of the total number of events for each region (Tables 6-8).
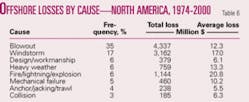
In North America, blowouts are the most frequent cause of loss, followed by windstorm, design/workmanship problems, heavy weather, fire/lightning/explosion, and mechanical failure (Table 6). The relative frequency indicates the number of events relative to the total that occurred over the time period in which loss reports were available.
On average, the most expensive incidents are fires ($20.8 million), followed by windstorms ($17 million), heavy weather ($13.3 million), blowouts ($12.3 million), and mechanical failure ($10.2 million).
Fire and windstorms often represent the largest loss by cause because of the total destructive nature. Fire and windstorms require topsides and structural replacement. Blowouts, windstorms, and fire represent 75% of the total indexed losses reported.
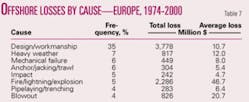
In Europe, design/workmanship incidents occur most frequently, followed by heavy weather, mechanical failure, anchor/jacket/trawl, and pipelaying/trenching problems (Table 7).
Similar to North America, fire events represent the largest average loss ($46.7 million) but at a substantially higher average level. Following fire events are blowouts ($20.7 million), heavy weather ($12.0 million), and design/workmanship ($10.7 million).
Because the average value of a platform in the North Sea is many times greater than an average Gulf of Mexico platform, when a fire occurs it is expected to be more destructive. Design/workmanship, fire, blowouts, and heavy weather contribute about three-fourths of the total indexed losses.
European blowouts are more costly than North American blowouts, but the impact of heavy weather losses are roughly comparable. North America and European losses reflect differences in the environmental conditions and the design requirements for offshore production.
In the Far East, blowouts are the most frequent loss occurrence, similar to North America, followed by design/workmanship, heavy weather, and mechanical failure (Table 8). Windstorms lead to the largest average loss ($25.3 million), followed by blowouts ($17.3 million) and heavy weather ($8.4 million). It is interesting to note that fire/lightning/explosion events in the Far East are not a major contributor to losses.
Blowout events
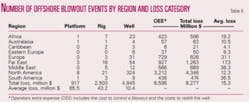
Total losses from blowouts include the direct physical loss or damage to platforms, rigs, and equipment (Table 9).
Operators extra expense (OEE) includes the cost to control a blowout and the cost to redrill the well. North America is responsible for more than half of the total losses reported. The Middle East and South America exhibit average losses nearly $38 million/blowout, while the Caribbean, Eastern Europe, and Australasia exhibit average aggregate losses in the range $4-10 million.
Average and total loss
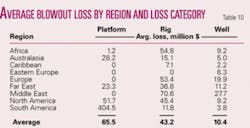
North America exhibits an average $9 million/blowout, while the Far East has a $37 million average rig blowout cost (Table 10).
Note that in several regions a small sample size may prevent the average statistic from being representative of the region. Most blowouts occur in exploratory drilling, but platform blowouts, which primarily represent development wells, are also common. Loss reports do not allow well blowouts to be assigned to drilling, production, or workover activity, and the occurrence of drilling vessel blowouts is small.
The average loss due to a platform blowout is significantly larger than a rig blowout, probably reflecting the higher valuation and potential damage associated with the platform. The average well blowout loss claim is $10.4 million.
Onshore blowouts
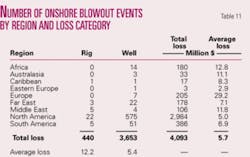
Sample sizes for most regions are relatively small, but for North America, South America, and the Far East, the data are sufficiently large to conclude that onshore blowouts are typically two to five times less costly than their offshore counterparts (Table 11).
null
Blowouts by TD
There is no apparent trend in average loss with total drilling depth in North America, the Far East, and Europe, although North American losses tend to be lower on average than other regions (Table 12).
null
Fire/lightning/explosion
Europe and North America dominate offshore fire losses, but relative to the total onshore loss ($38.762 billion), the offshore total is relatively small (Table 13).
Platforms ($3.450 billion), FPSOs ($553 million), and rigs ($359 million) comprise the major elements. Floating storage units and pipelines statistics are skewed probably because of the sample size.
Design/workmanship events
Europe dominates design/workmanship problems ($3.765 billion), far exceeding North America ($389 million) and the Far East ($297 million) (Table 14).
This is partly explained by the hostile operating environment in the North Sea, where platforms need to be built to withstand the harsh conditions. Platforms and pipelines contribute the greatest amount to the loss categories, and on average, the loss statistics are roughly comparable across each category.
Next: How weather affects offshore energy losses.
