Mathematical model forecasts year conventional oil will peak
A new mathematical model can forecast when worldwide conventional oil production will peak with a minimal amount of information.
In recent years, many attempts to model conventional oil production have included poor assumptions that have resulted in a wide range of estimates for the peak production year. Peak year estimates have ranged from ~2004 to ~2040.1-7
Problems with some of these models include:
- The Association for the Study of Peak Oil and Gas (ASPO) and Bakhtiari models fail to explain fully the mathematics used to generate the models and hence the underlying assumptions are unclear.1 2
- The Deffeyes and Parker models use simplistic bell curves that do not adequately fit the data.3 5
- The EIA model includes the US Geological Survey (USGS) estimated 3 trillion bbl of recoverable oil and uses a reserves/production (R/P) approach to determine the decline rate.4 The latter approach is invalid.8
- The Wells model uses a bell curve fitted to the rest of the world data (RoW) that calculates the ultimate recoverable reserves of oil rather than the model requiring this information.6 7
- Hubbert’s bell curve requires essentially two assumptions.8 The first is that production at all times is at a maximum rate. This condition requires that there is sufficient demand for oil and no political interference, amongst others. The second assumption is that the estimate of ultimate recoverable reserves is accurate.
Such events as the two oil crises in the 1970s, the collapse of the Soviet Union, and production capacity exceeding demand in the 1990s have shown that the first assumption is invalid.
Model description
The new model for forecasting worldwide conventional oil production requires historic oil production data (HPD(x)) and an estimate of ultimate recoverable reserves.
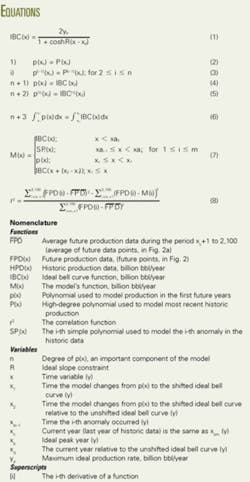
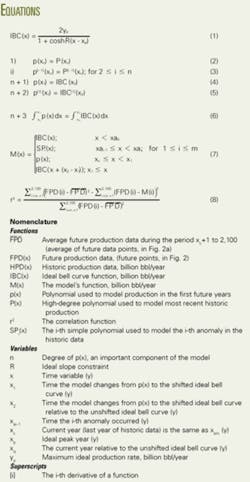
The model generates an ideal bell curve (IBC(x)) from Equation 1 (equation box) using data prior to anomalies in production. The curve has the total area equal to the ultimate recoverable reserves. The model considers crude plus NGL production.
In the equation, yp is the production at the peak year, R is a slope constant, x is the year, and xp is the peak year.
The xai-1 is the year the i-th anomaly occurred. Production after the anomalies is then modeled with m small-degree polynomials SPi(x) (degree 1 or 2, 1≤i≤m) fitted to the data until the model reaches the last historically known production point, HPD(xc). The xc is the last year of historically known production and let xam = xc.
The model then locates the unique point IBC(xq) on the ideal bell curve, where the amount of oil produced according to the ideal bell curve is the same as the amount of oil produced to the year xc.
In the next step, the model fits a high-degree polynomial to the most recent production data (P(x)) and solves Equations 2-6.
In the equations, p(x) is an n-th degree polynomial, where n is chosen. There are n + 1 variables in the polynomial and the extra variables x1 and x2. In essence, the polynomial p(x) assumes that current trends will continue, until reaching x1. At x1, the trend reaches the ideal bell curve shifted by x1-x2 so that the produced oil estimate from the ideal bell curve equals the estimate from the n-th degree polynomial.
Equation 7 defines the model M(x).
The model requires the availability of a good estimate of ultimate recoverable reserves and that current trends continue until production reaches the ideal bell curve.
Two bell curves randomly generated and added together indicate the accuracy of the model. The test requires selecting a random year xc between the 2 peak years and truncating the data at the random year. The model uses only production data up to year xc (HPD(x)) and ultimate recoverable reserves as inputs to estimate future production FPD(x).
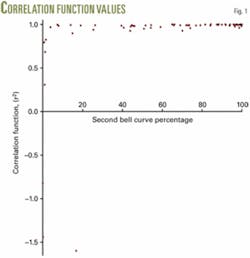
The model then calculates correlation factor r2 (Equation 3) for future data points (FPD(x)).9 Fig. 1 indicates the model’s accuracy.
In general, accuracy improves as the percentage of the second bell curve increases. A comparison of height at the last known date to height of the second-bell-curve peak gives the second-bell-curve percentage. If the second-bell-curve percentage is less than 5%, the model’s error increases significantly.
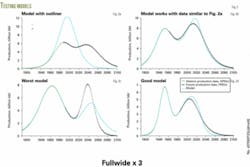
Fig. 2a shows the graph of the outlier with an r2 value of -1.6. The outlier occurs because the model failed to solve Equations 2-6 for n = 2, 3, and 4 and defaulted to the original ideal bell-curve estimate, which models the data accurately to 1960 and fails thereafter.
Fig. 2b shows a similar data set in which the model could solve Equations 2-6 for n = 4.
The model is incapable of accurately modeling the data if historic production data stops before 1% of the second-bell-curve production occurs.
Fig. 2c shows the curve with lowest r2 value (r2 = 0.68) that excludes the outlier (r2 = -1.6) and historic production data with <1% of the second-bell-curve production. As expected, the data have the smallest percentage greater than 1% from the second bell curve.
Fig. 2d depicts a graph of an accurate model (r2 = 0.97). In the figure, 60% of the second bell curve is contained in the HPD(x).
The testing indicates that the model is robust (average r2 = 0.96) and capable of accurately modeling future data if historic production data from the second bell curve is greater than 1%. The average r2 calculation excludes data with less than 1% of the second bell curve in the data.
Predicting peak oil
The model requires conventional oil production data and an estimate of the world’s total recoverable conventional oil, such as from References 10 and 11.
The following example calculation breaks world data into three sections: OPEC, FSU, and RoW. Angola recently joined OPEC; however, for this example it is considered part of RoW.
The world has produced about 1,030 billion bbl of conventional oil, broken down as 400 billion bbl from OPEC, 160 billion bbl from FSU, and 470 billion bbl from RoW.
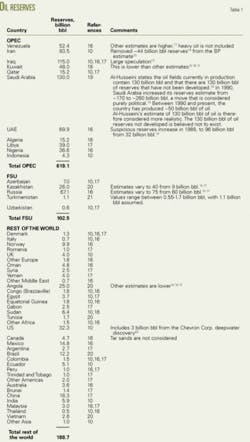
Table 1 lists estimated proved reserves. Estimates for the UAE, Kuwait, Iraq, Iran, and Saudi Arabia’s oil reserves remain uncertain.12-15
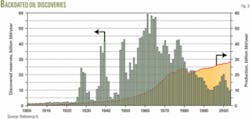
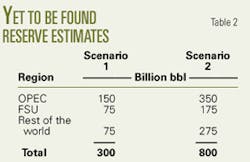
Fig. 3 shows a distinct trend since the late 1960s of a decline in oil discoveries.6 Scenario 1, therefore, assumes this trend will continue and lead to the discovery of an additional 300 billion bbl of oil.
It is possible that one or two large fields may be discovered similar to one in the late 1920s and another in the 1930s that contained 100 and 170 billion bbl, respectively. Scenario 2, therefore, assumes three large fields totaling 500 billion bbl will be found in addition to the 300 billion bbl.
Table 2 shows the distribution of this assumed additional oil.
Scenarios 1 and 2 then have ultimate oil recovery of 2,234 billion bbl and 2,734 billion bbl, respectively. With these values, the model generates Figs. 4a and 4b.
A reasonable assumption from analysis of the model is that if the ultimate recovery estimate is accurate, then the model should be accurate for RoW and FSU. Also reasonable given past OPEC oil production trends is to assume future OPEC production will have anomalies that are impossible to predict as to when they occur or their significance.
Scenarios 1 and 2 estimate that world’s conventional oil will peak in 2012 and 2024, respectively. Non-OPEC production peaks in 2009 in Scenario 1 and in 2017 in Scenario 2.
The world has large unconventional oil reserves and various programs are developing alternative sources of energy; however, supply disruption is unavoidable unless these sources are developed prior to the peak in conventional oil production.
References
- Aleklett, K., “IEA accepts peak oil,” ASPO web site www.peakoil.net/uhdsg/
weo2004/AnalysisWorldEnergyOutlook2004.pdf, retrieved Mar. 30, 2007. - Bakhtiari, A.M.S., “World oil production capacity model suggests output peak by 2006-07,” OGJ, Apr. 26, 2004, pp. 18-20.
- Deffeyes, K.S., “World’s oil production peak reckoned in near future,” OGJ, Nov. 11, 2002, pp. 46-48.
- Wood, J.H., Long, G.R., and Morehouse, D.F., “Long-term world oil supply scenarios,” EIA web site http://tonto.eia.doe.gov/FTPROOT/petroleum/itwos04.pdf., retrieved Mar. 30, 2007.
- Parker, H.W., “Demand, supply will determine when oil output peaks,” OGJ, Feb. 25, 2002, pp. 40-48.
- Wells, P.R.A., “Oil supply challenges-1: The non-OPEC decline,” OGJ, Feb. 21, 2005, pp. 20-28.
- Wells, P.R.A., “Oil supply challenges-2: What can OPEC deliver?,” OGJ, Mar. 7, 2005, pp. 20-28.
- Cavallo, A.J., “Predicting the peak in world oil production,” Natural Resources Research, Vol. 11, No. 3, 2002, pp. 187-95.
- Urroz, G.E., “Non-linear regression and correlation,” Utah State University web site http://www.engineering.usu.edu/cee/faculty
/gurro/Classes/ClassNotesAllClasses/CEE3030/Slides/
Regression&DataFitting_Part2.pdf, retrieved Mar. 30, 2007. - BP Statistical Review of World Energy, June 2006, BP web site http://www.bp.com/statisticalreview, retrieved Mar. 30, 2007.
- Annual Statistical Bulletin 2005, Haylins, J., editor, OPEC web site http://www.opec.org/library/Annual%20Statistical%20Bulletin/interactive/FileZ/Main.htm, retrieved Mar. 30, 2007.
- Hussain, A., “Market gives OPEC opportunity to improve oil reserves data,” OGJ, June 27, 2005, pp. 20-22.
- “Conference hears contrasting outlooks for Iraq” OGJ, Apr. 17, 1995, pp. 26-27.
- Campbell, C.J., “Just how much oil does the Middle East really have, and does it matter?,” OGJ, Apr. 4, 2005, pp. 24-26.
- Kashfi, M., “Lack of data casts doubt on Iranian reserves hike,” OGJ, Nov. 1, 2004, pp. 20-21.
- World Oil reserves estimate, EIA web site http://www.eia.doe.gov/pub/international/iea2004/table81.xls, retrieved Mar. 30, 2007.
- OGJ reserves estimate, EIA web site http://www.eia.doe.gov/pub/international/iea2004/table81.xls, retrieved Mar. 30, 2007.
- “Kuwait oil reserves only half official estimate-PIW,” Reuters web site http://today.reuters.com/business/newsarticle.aspx?type=tnBusinessNews&storyID=nL20548125&imageid=&cap, Jan. 20, 2006, retrieved Mar. 30, 2007.
- Al-Husseini, S., “Rebutting the critics: Saudi Arabia’s oil reserves, production practices ensure its cornerstone role in future oil supply,” OGJ, May, 17, 2004, pp. 16-20.
- The World Factbook, CIA web site, www.cia.gov/cia/publications/factbook/index.html, retrieved Mar. 1, 2007.
- Caspian Sea Region: Survey of Key oil and gas statistics and forecasts, EIA web site www.eia.doe.gov/emeu/cabs/Caspian/images/caspian_balances.xls, July 2006, retrieved Mar. 30, 2007
- Mufson, S., “U.S. Oil reserves get a big boost,” Washington Post web site www.washingtonpost.com/wp-dyn/content/article/
2006/09/05/AR2006090500275.html, Sept. 6, 2006, retrieved Mar. 30, 2007.
The authors
Steve Mohr ([email protected]) is a PhD candidate at the University of Newcastle, Australia, and is currently modeling supply and demand of transport fuels to 2100 as part of his PhD requirements. Mohr has a combined chemical engineering and mathematics degree from the University of Newcastle, Australia.
Geoffrey Evans is professor of chemical engineering at the University of Newcastle, Australia, and has a research background in multiphase systems as well as in life cycle analysis and sustainable resource processing.
