Part 1: Oil companies adjust as government roles expand
In the energy industry, the world is not flat. Concentration of oil and gas resources in a handful of small, powerful, and resource-nationalistic governments and their respective national oil companies (NOCs) has created an uneven playing field for international oil companies (IOCs). The rules of the game are being challenged and altered in midcourse by NOCs at host-government direction. The changing competitive landscape will transform the role of traditional IOCs, completing a process that began 40 years ago with a shift in the balance of power favoring NOCs and resource holders.
Since 2003, high oil prices have provided NOCs the financing needed to pursue expansion at home and overseas. A class of NOCs that we call entrepreneurial NOCs (or commercial NOCs) has benefited particularly, moving aggressively overseas and in downstream activities. For traditional NOCs, such as Petroleos Mexicanos (Pemex) and Petroleos de Venezuela SA (PDVSA), high oil prices have provided governments a windfall for activities unrelated to oil but have not necessarily boosted oil investment.
NOC decisions about business and political strategies will affect oil and gas markets for years. NOC goals and priorities will differ from those of IOCs. In response, IOCs have sought to strengthen their ties with NOCs, but results are mixed.
Changing IOC roles
IOC access to equity oil and gas reserves decreased over the past 40 years, first due to nationalizations in the early 1970s and 1980s and then due to tougher exploration and development terms in the 1990s and 2000s. Currently, IOCs are finding it increasingly challenging to acquire new oil and gas reserves, and many of the promising worldwide basins for exploration and development are firmly under the control of NOCs. IOCs appear to be realigning their business strategies and may have to move away from their traditional role of full equity developers of oil and gas fields, to pursuing a variety of commercial arrangements with host countries and governments-from full equity interest to partial equity sharing and fee-for-services.
As their power and wealth grew, NOCs began to assert themselves in world energy markets, expanding their upstream as well as downstream footprints. Now, some NOCs are searching outside their home countries for equity oil and gas and are forming joint ventures and alliances with IOCs. NOCs need IOC technology and oil-field management expertise and are inviting IOCs to serve as contractors for field development-a role formerly filled by service companies. Recently, Gazprom rejected all partner and equity development bids from IOCs to develop giant Shtokman gas field off arctic Russia but apparently will bring in Statoil as a contractor.
Shrinkage of equity oil and gas owned by IOCs is dramatic. In the 1960s, 85% of global oil and gas reserves was fully open to IOCs’ equity participation, 14% was held by Soviet Russia, and the NOCs controlled less than 1%. This split has reversed, with the IOCs’ full open access falling to around 16% while NOC access to reserves has increased to 65%. IOCs still have limited access to reserves in places such as Russia and China that were previously off-limits, but even this access might fall victim to resource-nationalistic energy policies.
For example, both Shell and BP have been pressured to reduce their equity stakes in Russian oil and gas fields, which will benefit Russian companies such as Lukoil and Gazprom. Shell recently gave up its operator status in Sakhalin-2 after it reduced its interest from 55% to 25%, selling its share to Gazprom.
The dramatic decrease in access to oil and gas reserves for IOCs has impaired their ability to replace reserves. Reserve replacement ratios (RRRs) for almost all IOCs were higher than 100% between 1990 and 2004. Expected RRRs for 2005-10 are less than 100% for IOCs. Despite record revenues due to high oil and gas prices, IOCs are finding it increasingly difficult to find potential high-yield prospects, given the commercial and political risk inherent in many countries. This trend suggests that even more equity reserves will become concentrated in NOCs.
Expanding NOC roles
As the role of IOCs has changed, the NOCs have been busy transforming themselves from domestic, sovereign companies into global competitors. Asian and Russian NOCs are competing with IOCs for resources in Central Asia and Africa. Nationalizations are sweeping across South America. Political volatility in places such as Nigeria is making it difficult for IOCs to participate in equity development. Recent violence in the Niger Delta has dampened enthusiasm for several major oil and gas projects, including, for example, Brass LNG.
Today, over 100 NOCs control over three fourths of the world’s oil reserves and production. Over half of the NOCs own reserves outside their home countries, and they are vigorously acquiring more. In regions readily available for full ownership by IOCs, such as the Arctic, the deep waters of the Gulf of Mexico, West Africa, the US, and Canada, NOCs are increasingly competitive. For example, Lukoil has entered downstream refining and retail operations in the US; PDVSA has been active in the US for many years through its Citgo subsidiary; and Petrobras is active in deepwater areas of the Gulf of Mexico.
A fading bright spot for IOCs is Russia, holder of 5% of the world’s oil reserves and around 28% of gas reserves. Privatization in the 1990s created opportunities for IOCs to actively participate in oil and gas development without restriction on equity participation. Recently, however, the Russian government has exerted greater control over resource development.
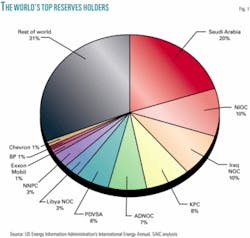
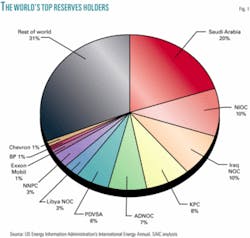
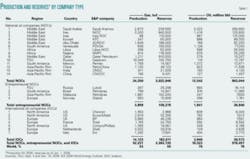
Unlike some NOCs, IOCs have no ability to influence oil prices and diminished ability to bring large new quantities of oil and gas to market. Fig. 1 shows that the world’s top eight holders of oil reserves are NOCs. Saudi Aramco is by far the largest, with a 20% share. The largest IOCs, ExxonMobil, BP, and Chevron, each has less than 1%. The largest IOCs rank higher in terms of global production (Table 1).
The 25 companies in Table 1 hold over 70% of worldwide oil production and reserves and over 50% of worldwide gas production and reserves. In the classification scheme used here, “entrepreneurial NOCs” are those that have been partially privatized and are run like commercial entities, typically venturing abroad in search of equity oil and gas.
Strategies and priorities
This analysis classifies NOCs and IOCs according to their goals and strategic directions and priorities. NOCs’ strategic priorities include optimization of resource development, revenue growth, supply security, and economic development. Many NOCs also have political priorities and are expected to execute government policies, which are sometimes in harmony and sometimes at odds with commercial strategies. Priorities for IOCs and entrepreneurial NOCs include increasing stockholder value, deploying technology, and expanding market access.
The classification scheme has four dimensions: resource, technology, finance, and markets. NOCs and IOCs can be either providers or seekers of resources and technology. They also can be either finance or market seekers, depending upon their cash flows, credit ratings, and market access. Here are the categories:
- Resource providers-companies that possess reserves sufficient to meet in-country demand and serve as primary exporters of oil and gas. These companies are generally national asset owners and usually are not actively involved in acquiring additional overseas reserves. Examples include big NOC oil exporters such as Saudi Aramco, National Iranian Oil Co. (NIOC), PDVSA, and Gazprom.
- Resource seekers-companies with indigenous reserves insufficient to meet in-country demand that are active in domestic exploration and acquiring equity reserves overseas. These companies are generally NOCs, such as Oil & Natural Gas Corp. of India, PetroChina, and China National Offshore Oil Corp. (CNOOC), whose mission is to find and develop reserves at home and overseas to secure supply. Resource seekers include IOCs, which must add reserves to maintain company value.
- Technology providers-companies highly adept at technology development and deployment. Companies in this category are willing and able to bring their technologies to the global exploration and production (E&P) marketplace. IOCs and entrepreneurial NOCs are becoming technology providers rather than equity developers. An example is Gazprom’s overture to Statoil to develop Shtokman field to benefit from Statoil’s expertise in operating in arctic offshore environments. Statoil will act as a prime contractor on the project rather than equity partner. Other technology providers include IOCs ExxonMobil, Chevron, ConocoPhillips, Shell, BP, and Total and entrepreneurial NOCs such as Petronas and Petrobras.
- Technology seekers-companies that are less adept with technology and need advanced technologies to explore and develop the resources they control. Companies in this category generally are resource rich NOCs such as Nigerian National Petroleum Corp. (NNPC), NIOC, Kuwait Petroleum Corp. (KPC), PDVSA, and Gazprom.
- Market seekers-companies that actively seek markets in which to sell indigenous or overseas equity oil and gas for maximum value. IOCs routinely look for the best prices for oil and gas from their global operations and can be considered market seekers. Most large NOCs also are market seekers; however, some, such as NNPC and PetroChina, focus more on domestic markets.
- Finance seekers-companies that have access to resources sufficient to meet in-country demand but that lack finances for exploration and development. These companies generally have difficulty raising capital from international markets because they lack a transparent and creditworthy economic system. Large resource-provider NOCs such as Pemex, PDVSA, NNPC, and NIOC can be categorized as finance seekers.
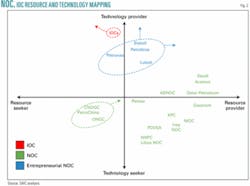
Fig. 2 illustrates the classification scheme for selected NOCs and IOCs, providing general insights into the roles and relative attractiveness of companies in the global oil industry. The figure shows the location of companies on the technology and resource spectrum.
The competitively best-positioned companies are both resource providers and technology providers and appear in the top right quadrant. The worst-positioned companies are those in the bottom left quadrant, which seek both resources and technology. IOCs are very strong technology providers but also are resource seekers. Eight of the 14 NOCs are resource providers but are technologically challenged (bottom right quadrant). The entrepreneurial NOCs generally fare the best, being resource holders as well as technology providers.
NOCs and IOCs have mutual interest in marrying technology and resources. Despite this apparent alignment of interests, host-government national policies and politics often limit cooperation.
Arrows in Fig. 2 indicate the direction some of the NOCs, entrepreneurial NOCs, and IOCs are likely to take. IOCs will tend to move to the left, indicating their strong technology but continued weakening resource positions. Entrepreneurial NOCs will move higher to the top right quadrant, indicating greater technological expertise and their ability to access new resources. The bottom left quadrant companies probably will find it difficult to move out of their position but would work hard to move to the top right quadrant. For the time being, major NOCs will likely stay in the bottom right quadrant, obtaining technologies from IOCs and entrepreneurial IOCs. NOCs and IOCs will have to find innovative ways to cooperate to make this work.
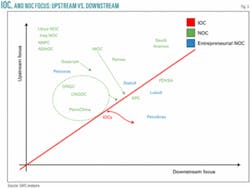
Fig. 3 indicates the upstream and downstream focus of NOCs and IOCs. Companies next to the 45º line possess a relatively balanced portfolio of upstream and downstream assets. Most IOCs fall in this category. In addition, large resource-provider NOCs such as PDVSA also are well-balanced with respect to upstream and downstream focus.
Most other NOCs-such as NNPC, Libya’s National Oil Corp., Iraq National Oil Co., and Abu Dhabi National Oil Co. (ADNOC)-emphasize upstream operations, in some cases because other companies operate refineries. These NOCs and entrepreneurial NOCs may not change focus dramatically in the near term.
The potential upstream-downstream shift of IOCs, Asian NOCs, Gazprom, and NIOC is shown by arrows in Fig. 3. Most refinery capacity expansions will be in energy-hungry Asian economies-China and India-where IOCs may be able to bring their technologies to work when they collaborate with NOCs. In addition, NIOC may need to expand refinery capacity in order to meet Iran’s growing demand for petroleum. Gazprom is gearing up for more downstream activity as well.
Strategic focus
Among the many strategic thrusts of NOCs and IOCs, four will be highlighted here: natural gas projects (including LNG and GTL), deepwater E&P, oil sands and heavy oil, and global refining.
Gas projects
With Europe, North America, and Asia facing natural gas shortages and with gas demand expected to grow, most IOCs and NOCs are investing in future supply and LNG infrastructure.
Crucial to meeting global gas demand is the Middle East, which can serve Asian, European, and North American markets and where NOCs are taking the lead. Qatar Petroleum soon will be the world’s largest LNG exporter, tripling its LNG capacity to 77 million tonnes/year (tpy) by 2010. NIOC recently signed a 25-year deal with GAIL (India) Ltd. for delivery of LNG and is in discussions with CNOOC and others to develop giant North Pars gas field off Iran. LNG export terminals also are under development in Yemen and Oman. Most major IOCs have investments in Middle East LNG terminals and are acting as technology providers.
West Africa is another area of major gas development where NOCs are taking the lead using IOC technology. Almost 30 million tpy of LNG export capacity is under development in Nigeria, Equatorial Guinea, and Angola. In West Africa, IOCs generally have negotiated favorable production-sharing agreements with NOCs and are acting as technology providers and resource holders.
Europe receives gas from the Middle East, North Africa, the North Sea, and Russia. Gas supplies from North Africa and the Middle East are predominantly NOC-owned, while supplies from the North Sea are predominantly from IOCs. Russia’s Gazprom recently has been seeking to capture value for its exports by raising prices to former Soviet republics toward parity with European gas prices.
The International Energy Agency reports that by 2010 around 167 million tpy of gas liquefaction capacity is planned, representing close to $73 billion of investment. If “proposed” terminals are considered, the worldwide investment in liquefaction capacity can reach close to $100 billion by 2010. Nearly half of the planned capacity will occur in the Middle East and North Africa. Most of the planned LNG is destined for Asia, Europe, and North America.
IOCs and NOCs have dedicated a small portion of their investment to gas-to-liquids technology. Shell and Chevron have a plant each, and Chevron teamed with Sasol for a GTL plant in Qatar that came online in 2006. Chevron also is working with NNPC on a 34,000 b/d GTL plant in Nigeria.
Two other GTL plants are in advanced planning stages and can be operational by 2010. One is a Shell joint venture with Qatar Petroleum for the Qatar GTL Pearl 1 plant. The other is Sonatrach’s GTL plant in Tinhert, Algeria.
Estimated costs for GTL plants have leaped to $84,000 per b/d of capacity from $20,000-30,000 per b/d a few years ago. Increasing costs have resulted in ExxonMobil’s pulling out of its Qatari GTL project. Others may follow due to increased costs of the technology.
Deepwater E&P
In deep water, IOCs enjoy a strong technological advantage and are expected to quadruple spending over the next several years. Deepwater prospects are in some of the few regions where IOCs can operate relatively unhindered by NOC terms and conditions and can obtain full equity participation. In addition, deepwater prospects offer hope for the large discoveries that IOCs need to replace production.
The term “deep water” generally means more than 1,000 ft. The Gulf of Mexico, where water-depth records are continually broken, is the focus of future deepwater activity. Deepwater production in the gulf has shown average growth rates of over 16%/year since 1985 for oil and over 20%/year for natural gas. In 2006, the deepwater gulf produced 293 million bbl of oil and almost 1 tcf of gas-72% of the gulf’s oil production and 40% of its gas.
Other areas of deepwater development include the Norwegian and UK North Sea and offshore Brazil, West Africa, and Australia.
IOCs lead in deepwater investments. Chevron is involved in some of the world’s most challenging deepwater projects. Its Jack 2 well on Walker Ridge Block 758 in the Gulf of Mexico is in 7,000 ft of water. Three of its five biggest projects under development are in deep water: the Tahiti project on Gulf of Mexico Green Canyon Block 640; the Benguela Belize-Lobito Tomboco (BBLT) project off Angola; and the Agbami project off Nigeria, where Chevron is collaborating with Statoil, Petrobras, and NNPC. Shell is active in Nigeria’s Bonga field in the Niger Delta in water more than 3,000 ft deep. Companies such as BHP, Eni, and Total also are active in deep water, as are large independent producers such as Anadarko Petroleum, especially in the Gulf of Mexico.
Petrobras is by far the dominant NOC involved in deepwater activities, mostly off Brazil but also in the Gulf of Mexico and off West Africa. Petrobras is working in four deepwater areas of the Gulf of Mexico, where it plans to spend close to $1.5 billion by 2011. A key area is the ultradeepwater Desoto Canyon region, where Petrobras is applying technologies developed off Brazil, including floating production, storage, and offloading (FPSO) systems.
Nonconventional oil
Most oil sands and heavy oil projects are in Canada and Venezuela. Of 10 such projects to be completed by 2010, eight are oil sands projects in Canada, and two are heavy oil projects in Venezuela.
These capital-intensive projects are well-suited to IOC participation. IEA estimates the cost of a Canadian oil-sands mining operation at $45,000-60,000 b/d of capacity, with in situ projects about half that.
ConocoPhillips has teamed with Canadian independent EnCana to develop oil sands in the Foster Creek, Christina Lake, and Borealis projects. ConocoPhillips also is involved with Syncrude’s third phase at Fort McMurray, Alta., where an upgrader expansion will boost capacity from 2005 levels by 50%. Shell expects to increase production in the Athabasca region to 500,000 b/d from 155,000 b/d by 2010.
In eastern Venezuela, PDVSA estimates that over 235 billion bbl of oil reserves exist in the Orinoco heavy oil belt.
A key to full realization of the potential of these nonconventional resources will be technology and, more precisely, how to improve recovery rates at acceptable costs. This is a role IOCs can fill. An issue of heavy oil and bitumen development in Venezuela will be the extent to which nationalist policies deter IOC participation.
Global refining
With worldwide spare refining capacity rapidly diminishing, new capacity will be critical as demand grows for oil products and the crude slate becomes increasingly heavy and sour.
Low and uncertain refining returns discouraged IOCs from investing in capacity expansion until recently. The average refinery margin worldwide has improved to over $8/bbl in recent years, high enough to encourage investment. IEA expects average refinery spending to increase to $300 billion/year in the next 5 years from $215 billion/year in the last 5 years. Most greenfield investment will be in China, India, and the Middle East.
In partnership with international companies with specific expertise, Saudi Aramco is exploring the possibility of building two grassroots export refineries in Saudi Arabia. It has signed an agreement with Sumitomo Chemical Co. of Japan to transform its Rabigh refinery through joint venture PetroRabigh into a fully integrated petrochemical complex. And it is exploring plans to develop joint-venture petrochemical complexes integrated with the Ras Tanura and Yanbu refineries.
In Kuwait, KPC plans to spend over $5 billion through 2010 to upgrade its refining industry and to increase capacity to process its heavy and sour crude. Outside Kuwait, KPC’s strategy is to expand refining and marketing outlets in high-growth areas, especially in China and India, through downstream joint ventures with NOCs as well as IOCs such as Shell and BP.
PetroChina also has invested heavily in refinery upgrades and expansions while reducing capacity through selected plant and facility closures. It is trying to better match product yields to the Chinese market.
Entrepreneurial NOC Lukoil plans to upgrade refineries to produce high-quality products matching Euro-3 and Euro-4 standards. Eni is investing in conversion capacity to raise its refining system’s yields of middle distillates and to achieve greater vertical integration with its E&P activities.
In the US, Chevron is expanding its Pascagoula refinery and plans to increase capacity for gasoline production by 15% by 2008. ConocoPhillips expects to invest $4-5 billion over the next several years at 9 of its 12 US refineries, increasing its output of clean fuels by 15%. This increase is the equivalent of adding a world-scale refinery.
Elsewhere, ConocoPhillips last year acquired the 275,000 b/d Wilhelmshaven, Germany, refinery and among other things, plans investments to increase the facility’s ability process heavy crudes such as Russian export blends.
Acknowledgment
The authors prepared this article for information and discussion purposes only. The authors’ views and opinions do not necessarily state or reflect those of SAIC.
The authors
Shree Vikas ([email protected]) is director of energy markets at Science Applications International Corp. (SAIC), where he develops and applies smart energy analytics for evaluating energy market trends, market intelligence and gas and power sector assessments. Some of his recent assignments have included the study of strategic investment activities of NOCs and equity access challenges of IOCs; market barriers and drivers for back-up fuel use for increased reliability; and assessment of pending carbon policies on US power, gas and refinery industries. He also is an adjunct faculty member in the energy resources management and policy program at University of Maryland University College. Vikas has a PhD in petroleum and natural gas engineering and a master’s in environmental policy from Penn State.
Chris Ellsworth ([email protected]) is director of natural gas and LNG services at SAIC, where he provides international gas, LNG, and power market analysis and project due diligence. He has served as lead analyst for a number of energy projects, including assessments of natural gas markets in Asia, North America, South America, Europe, and Russia to support infrastructure finance and construction projects. Ellsworth has an MS in economics from the University of Houston and a BS in geology from King’s College, London.
