GLOBAL OFFSHORE OIL-2: Growth expected in global offshore crude oil supply
This is the second of two parts on the outlook for global offshore oil discoveries, production, and reserves.
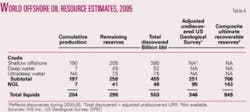
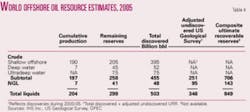
The reserve base is the sum of cumulative production and remaining reserves; these two combined with undiscovered potential (or yet-to-find) give the ultimately recoverable reserves (URR).
Estimates for the first two may be obtained from IHS Inc. IHS uses a systematic, bottom-up approach compilation of known technically recoverable estimates (proved and probable) for discoveries, but these numbers are also subject to uncertainty.
Estimates for undiscovered oil (crude and NGL) in offshore provinces are only available from the US Geological Survey’s 2000 world petroleum assessment. The USGS methodology is based on assessments of a total petroleum system (TPS) of known and frontier provinces, which is a less restrictive measure than known field-by-field estimates.
Table 4 shows the global offshore reserve base at end 2005 based on a combination of these two sources adjusted for discoveries and type of liquid. But how can we get a second opinion?
Alternative 1: decline curve
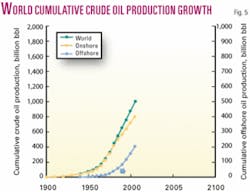
The world has produced/consumed 1 trillion bbl of crude oil in the last 150 years, of which roughly 800 billion bbl came from onshore oil fields and 200 billion bbl from offshore.
Fig. 5 shows the cumulative production growth patterns of each genre that are remarkably similar except for the phase lag in development. Offshore production started 40 years later.
Characteristically the cumulative production curve begins growing exponentially up through the half-life point of the reserves (Q = K/2); thereafter it reverts to an exponential decline pattern, finally approaching asymptotically the value K, the ultimate reserves of the field.
Overall it resembles a somewhat S-shaped curve that is best represented by the logistic equation1:
null
Q is cumulative production, K ultimate reserves, ro the initial growth rate constant, and the constant a which has no physical significance. Unfortunately, it is not possible to curve fit equation (1) and obtain a unique set of values for the three constants. However, the derivative of Equation 1, namely:
null
defines a straight-line relationship between production decline, (dQ/dt)/Q, and Q. This constraint allows the establishment of definitive values for K and ro.
Generally the straight line trend would kick off after a substantial volume of oil has been produced, at least 25% of the ultimate reserves. This has been the observed2 decline behavior of oil production in many producing countries with large onshore production.
However, global offshore production is still in its early exponential growth stage, and this precludes the use of production decline analysis to establish its K-value. Laherrere3 developed an elegant parabolic fractal distributions approach to estimate the K-value for a region with only few estimates about the size of the largest fields, a condition very akin to the offshore environment that is in a nepionic stage of development.
The methodology, however, assumes that the discovery of large fields has peaked and that no additional fields will be discovered. As discussed before, this is unlikely to be the case. The parabolic fractal method, moreover, requires the determination of three free constants, none of which has any physical significance; a physical tie would normally allow obtaining independent anchor values.
Alternative 2: exploration by analogy
In order to establish a second estimate for the global offshore crude oil reserve base, a heuristic approach7 is proposed, using an assumed analogy of the size distributions of the giant oil fields discovered to date in both the onshore and offshore environments.
The basis for the analogy stems from the premise and observation that oil fields are often found together in the most important hydrocarbon provinces and petroleum systems. Moreover, giant oil fields are the core of the oil industry because they provide a significant share of the world’s production and reserves.
This methodology requires knowledge of the global onshore reserve base for comparative purposes. This was obtained by using two methods: decline curve analysis and data from IHS.
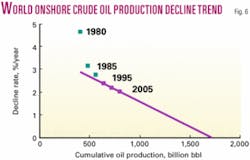
The oil production decline performance for global onshore crude since 1980 is shown in Fig. 6. The linear trend line starts in the early 1990s and extrapolates to a K-value of 1,800 billion bbl, thus indicating that onshore production would reach its half life in the next 6 years at current production rates.
The least squares-fitted trend line has a correlation coefficient of 0.984. IHS estimates that at the end of 2005, the reserve base for the global onshore stood at 1,838 billion bbl. It is worth mentioning that both estimates exclude undiscovered oil potential and reserve growth.
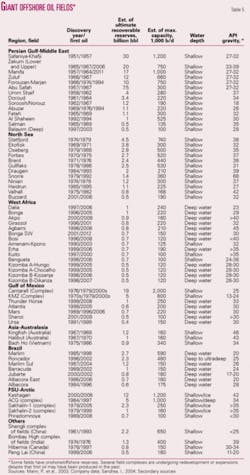
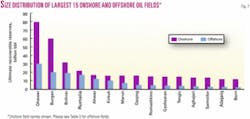
Table 5 summarizes the ultimate reserves and production capacity of the 67 giant offshore oil fields discovered to date. Fig. 7 compares the size distributions of the 15 largest onshore and offshore fields.
The largest onshore oil giants range in size from 80 billion bbl to 12 billion bbl of ultimate reserves. In comparison, the offshore giants range in size from 30 billion bbl to 2.5 billion bbl.
In general, the mean size of the onshore giants is three times that of the offshore giants, 24 billion bbl vs. 8 billion bbl. Consequently, the expected value of the offshore crude reserves would be around 600 billion bbl, corresponding to one-third of the K-value estimated for the onshore.
Using the tail-end values of the offshore size distribution, it is also possible to obtain a range of values. The high end corresponds to the oil fields of the Persian Gulf. They are the largest offshore oil fields in the world, varying in size from 30 billion bbl to 4 billion bbl. Their onshore counterparts are also the biggest in the world. The size ratio of onshore to offshore fields is estimated at 2.5.
At the low tail-end of the distribution are the giant oil fields discovered in the Gulf of Mexico. With the sole exception of the fields in Mexico, the largest fields discovered in the Gulf of Mexico to date tend to be relatively small, less than 1 billion bbl, and average 500 million bbl and less. The onshore fields contiguous to the gulf are also relatively small.
The 10 largest onshore oil fields in the US Lower 48 have sizes varying from 6 billion bbl to 1.4 billion bbl with an average of 2.5 billion bbl. The size ratio for the onshore Gulf of Mexico is 5, which is twice that for the Persian Gulf.
These size ratios would indicate that the offshore reserve base can range from 720 billion bbl to 360 billion bbl.
The heuristic methodology shows that the average estimate for the global offshore oil reserve would be closer to 600 billion bbl, which is nearly 30% more than the IHS bottom-up estimate; considering the difference in the approach, the proximity of the results is reassuring. However, given that both methodologies may not apply to unexplored regions with probably significant reserves and potential, it can be concluded that additional offshore reserves must exist over and above this new estimate.
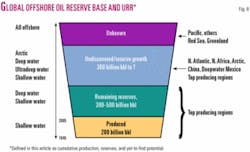
By combining the average result of the heuristic approach with the USGS 2000 assessment estimate for undiscovered oil, the URR for the global offshore could be closer to 1,000 billion bbl, of which just 200 billion bbl have been produced (Fig. 8).
Production potential
Shallow offshore oil production in several underexplored hydrocarbon rich provinces including China and Caspian is just ramping up; it may be a slow ramp up but the fact is that it is increasing and will continue to do so.
The shallow offshore is expected to continue to grow at a slower pace to the end of this decade until the pressure from declining North Sea oil is reduced. At least three giant fields will contribute significant volumes in the medium term: Azeri-Chirag-Guneshli, Manifa, and Kashagan; however, more than 200 fields will be developed. On the other hand, deepwater oil production will double over the next 5 years, underpinned by more than 60 projects globally grouping an even larger number of fields.
It is very possible that with the rapid rate of increase deepwater will reach its maximum level in the medium term due to the nature of turbidite reservoirs. However, this scenario remains uncertain due to the potential impact of technology and unexplored deepwater provinces, both of which could extend the growth and certainly the postpeak production level.
The ultradeep water will remain constrained, but in 5 years several fields will be producing in the US gulf, Angola, and Brazil. Offshore production in Russia/Arctic is also just taking off with new production from Sakhalin, Pechora, and the Barents Sea.
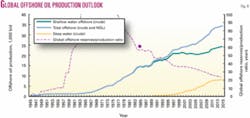
Fig. 9 shows historical and modeled future world offshore oil production. Deepwater is included separately given the importance of this source. The near to medium term has been modeled with known projects (over 200) and assumed decline rates. The model has also been calibrated so that projected R/P ratios remain stable.
There is no doubt that global offshore oil production will continue to grow strongly in the medium term; in fact, various tests of the model show that global offshore crude oil production could grow to 34 million b/d by 2020.
Long term, once the R/P ratio reaches 10 to 15 and cumulative production exceeds 50% of URR, it is expected that production will start to level off and then decline. The current global R/P is over 32, and by 2015 it will be 23.
Based on an URR of 1,000 billion bbl, we have produced 20% and by 2015 we would have produced 35%. Given that there are uncertainties about the timing of new oil, impact of potentially large discoveries, and deliverability issues, the long term is not modeled here, but there should be no doubt that offshore production will continue to perform strongly.
Top offshore producers
In contrast to conventional wisdom, the world’s largest offshore producers include primarily national oil companies.
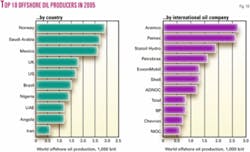
Six of the top 11 offshore producers are NOCs. Saudi Aramco is the world’s largest, followed by Pemex. The merger of Statoil with Hydro will create the third largest, followed by Petrobras.
The international oil companies with the largest offshore oil production are Exxon, followed by Shell, Total, and BP. Fig. 10 shows the top offshore producers based on the estimated net entitlement offshore oil production in 2005. For Statoil Hydro, it includes the operated share of the Norwegian state (Petoro).
It is interesting to note that a simple review of the medium and long term strategy of the top companies shows that a big part is geared towards offshore operations, which is consistent with the bright picture for the global offshore discussed in this article.
Saudi Aramco has a tremendous opportunity set in its own back yard managing and developing the latest technologies on the world’s largest offshore oil discoveries. Pemex has some very large mature offshore fields in its own back yard, but is also developing large complex fields in shallow water. Pemex is also moving to access the highly prospective deepwater basins, but this will take time as the company is not prepared for this type of environment.
Statoil Hydro combined will operate a significant portion of Norway’s oil and gas production, and this may give the group more flexibility to explore mature parts of Norway and the far north. Interestingly, the Norwegian giant will have special characteristics that are unique among NOCs, such as a growing important international business, world class shallow EOR experience, deepwater experience, management of complex oil and gas offshore developments, and arctic experience.
Petrobras is world leader in deep water and is primarily engaged at home with many developments; the future of offshore Brazil is also bright.
Looking forward, over $200 billion will be invested in new offshore oil projects in the next 6 years alone, the bulk of which will come from NOCs.
Acknowledgments
Special thanks to Ken Chew of IHS Inc. and to Thomas Ahlbrandt, former USGS project chief. The views expressed in this report are those of the authors and do not represent those of OPEC.
References
- Stark, P., and Chew, K., “Global oil resources: issues and implications,” Journal of Energy and Development, Vol. 30, No. 2, 2005.
- Ahlbrandt, T., et al., “Global resource estimates from total petroleum systems,” AAPG Memoir 86, 2005.
- Ahlbrandt, T., “Oil and natural gas liquids: global magnitude and distribution,” Encyclopedia of Energy, 2004.
- Campbell, C.J., “The Golden Century of Oil 1950-2050: The Depletion of a Resource,” Kluwer Academic Publisher, Dordrecht, 1991.
- Sandrea, R., “What about Deffeyes’ Prediction that Oil will Peak on 2005?,” MEES, Sept. 12, 2005.
- Staniford, S., “Hubbert Theory says Peak is Slow Squeeze,” www.theoildrum.com, Dec. 5, 2005.
- Sandrea, R., “Global Natural Gas Reserves-A Heuristic Viewpoint,” MEES, Mar. 13 and 20, 2006.
- Halbouty, M.T., “Giant oil and gas fields of the decade 1990-2000,” AAPG convention, Denver, 2001.
- Murray, A., and Latham, A., “World’s arctic basins pose array of unique work opportunities,” OGJ, Nov. 13, 2006.
- Mann, P.L., Gahagan, L., and Gordon, M.B., “Tectonic setting of the world’s giant oil and gas fields,” in Halbouty, M.T., ed., “Giant oil and gas fields of the decade 1990-99, AAPG Memoir 78, 2001.
- Sandrea, I., “Deepwater oil discovery rate may have peaked; prodution peak may follow in 10 years,” OGJ, July 26, 2004.
- Cavallo, A.J., “Predicting the peak in world oil production,” Natural Resources Research, Vol. 11, 2002, pp. 187-195.
- Sandrea, R., “What about Deffeyes’ Prediction that Oil will Peak in 2005?,” MEES, Sept. 12, 2005.
- Laherrere, J., “Parabolic fractal distributions,” presented at the French Academy of Science, Apr. 4, 1996.
