Trap types can be instructive in Gulf of Mexico shelf search
Most exploration on the Gulf of Mexico shelf off Louisiana and Texas has been based on the search for the types of traps in which oil and gas have previously been found.
The first question that arises is which types of trap have been the most successful for oil and gas reserves in the gulf, and the second question is what reservoir properties can be expected in those trap types.
All oil and gas traps in a series of data published by the University of Texas Bureau of Economic Geology1 may be classified as structural or stratigraphic traps.
Structural traps accounted for 93% of the reported traps on the gulf shelf, 94% of the released oil reserve data, and 91% of the released gas reserve data. Stratigraphic traps accounted for 7% of the reported traps, 6% of the released oil reserve data, and 9% of the released gas reserve data.
Twelve types of traps in the Gulf of Mexico have information about reservoir properties publicly available, and 11 types have information about oil and gas reserves. One type of trap, patch reefs, has no oil or gas reserves published, so only property values were included.
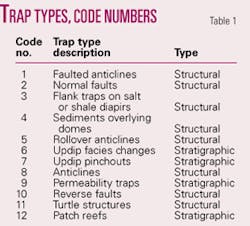
Table 1 shows the types of traps the BEG listed with the code number used in this article for each type of trap in the following graphs and the classification whether structural and stratigraphic.
The most common trap type is the faulted anticline, 32% of the total, followed by normal fault traps with 18%, flank traps on salt or shale diapirs and traps in sediments overlying domes each with 14%, and rollover anticlines with 13%. These five types account for 91% of the BEG-reported traps.
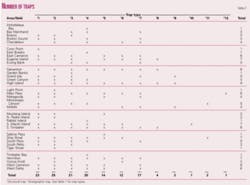
A total of 35 lease areas has been recognized in the gulf for which data have been published. Table 2 shows the areas, types of traps, and number of each type in each area. These areas include fields, reservoirs, and pools, but they were not separated on that basis.
Most common trap types in these areas were traps with normal faults (Type 2) found in 18% of these areas. Traps in faulted anticlines (Type 1) and flank traps on salt or shale diapirs (Type 3) were found in 16% of the areas. Traps in sediments overlying domes (Type 4) were found in 14% of these areas. Traps in rollover anticlines (Type 5) were found in 10% of the areas.
The High Island area had nine types of trap. The areas known as Galveston, Main Pass, and South Timbalier had eight types of trap each.
Patch reefs (Type 12) were found only in the Main Pass area, and reverse faults (Type 10) were found only in the Ship Shoal area.
Nine areas had only one type of trap reported. These areas are Atchafalaya Bay, Coon Point, East Breaks, Garden Banks, Light Point, Rabbit Island, Sabine Pass, Tiger Shoal, and Timbalier Bay.
Several of the reported areas such as Eugene Island, Vermilion, and West Cameron do not have complete data as numerous oil and gas reserves were reported with no trap type listed.
Eight of these areas had their largest oil reserves in traps on the flanks of salt or shale diapirs (Type 3). These include Eugene Island, Garden Banks, Green Canyon, Main Pass, Mississippi Canyon, Ship Shoal, South Pass, and Viosca Knoll. Only one, South Marsh Island, had its largest oil reserves in traps in updip pinchouts (Type 7).
Four of the areas, High Island, Matagorda Island, Ship Shoal, and South Timbalier, had their largest gas reserves in faulted anticlines (Type 1). Three of these areas, Eugene Island, Garden Banks, and South Marsh Island, had their largest gas reserves in traps on the flanks of salt or shale diapirs (Type 3).
Two of the areas, Mobile and Vermilion, had their largest gas reserves in updip pinchout traps (Type 7), one area, Mississippi Canyon, had its largest gas reserves in traps in normal faults (Type 2), and one area, West Cameron, had its largest gas reserves in rollover anticlines (Type 5).
In the Gulf of Mexico, little study has been released of the variations in reservoir properties even though such knowledge can assist in future planning and producing activities for oil and gas fields, reservoirs, and pools. The following sections sum up reservoir properties separated by trap types for all data available.
Only 62% of the released data disclosed oil reserves, and only 68% of the released data disclosed gas reserves.
Reservoir properties reviewed included production depths, thickness of pay zones, productive area, and producing formation porosity, temperature, and pressure. Unless data are released about deepwater reservoirs in the gulf, reviews must be limited to wells drilled to 22,600 ft or less in 3,300 ft of water or less.
Field demographics
Published data on reservoir properties in the Gulf of Mexico are limited and show considerable variation.
For the published properties, the depth of production averaged 7,842 ft and ranged from 750 ft to 22,600 ft.
Pay thickness averaged 47 ft and ranged from 2 ft to 490 ft.
Productive area averaged 1,070 acres and ranged from 5 acres to 26,404 acres.
Porosity averaged 29% and ranged from 5% to 39%.
Formation temperature averaged 171° F. and ranged from 80° to 414° F.
Formation pressure averaged 4,084 psi and ranged from 520 psi to 15,938 psi.
Water saturation averaged 29% and ranged from 7% to 80%.
Water depth of traps averaged 133 ft and ranged from 3 ft to 3,318 ft.
For comparison, average data for each reservoir property value along with low and high values were determined for each trap type.
Oil reserves
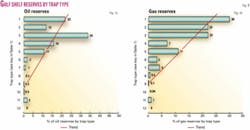
Fig. 1a shows the distribution of oil reserves by trap type for areas on which data had been released. Structural traps include types 1, 2, 3, 4, 5, 8, 10, and 11. The largest share of oil reserves was 34% in traps on the flanks of salt or shale diapirs (Type 3).
Traps on the flanks of salt or shale diapirs (Type 3), faulted anticlines (Type 1), and traps with normal faults (Type 2) had 68% of the total oil reserves.
Stratigraphic trap types 6, 7, and 9, had 7% of the oil reserves.
Fig. 1B shows the distribution of gas reserves by each trap type released. The largest share of gas reserves was 30% of the total in faulted anticlines (Type 1). Three trap types, faulted anticlines (Type 1), normal faults (Type 2), and flank traps on salt or shale diapirs (Type 3) had 74% of the total gas reserves. Stratigraphic traps had 7% of the total gas reserves. Percent of oil and gas reserves for Oligocene and Jurassic traps were not shown on the graphs.
Trap distribution
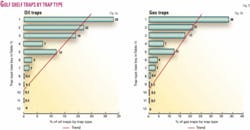
Fig. 2a shows the distribution of oil traps by trap type. Largest share of oil traps was in faulted anticline traps (Type 1). The three main structural oil traps made up 74% of the oil traps.
null
Stratigraphic traps had 5% of the oil traps. Fig. 2B shows the distribution of gas traps by trap type. Largest percent of gas traps was in faulted anticlines (Type 1). The three main structural traps had 74% of the total gas traps. The three largest stratigraphic traps had 7% of the gas traps.
Trap depth, thickness
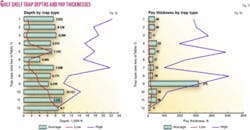
Fig. 3a shows the average, shallowest, and deepest depth for each trap type for all data available. Shallowest average depth was 4,045 ft for Type 6 traps, and the deepest average depth was 10,137 ft for Type 10 traps. Shallowest depth recorded was 750 ft in Type 3 traps, and the deepest depth recorded was 22,600 ft in Type 1 traps.
Fig. 3b shows average pay thickness and thinnest and greatest pay thickness for each trap type. The smallest average pay thickness was 9 ft for Type 12 traps, and the greatest average pay thickness was 315 ft for Type 9 traps. The smallest pay thickness recorded was 1 ft in Type 4 traps. Largest pay thickness recorded was 510 ft in Type 9 traps.
Areal extent, porosity
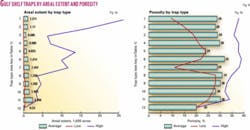
Fig. 4a shows the average acres and lowest and highest values for each trap type. Smallest average area was 230 acres for Type 12 traps, and the largest average area was 2,266 acres for Type 11 traps. Smallest acreage was 5 acres in Type 1 traps, and the largest acreage was 26,404 acres in Type 2 traps.
Fig. 4b shows the average, lowest, and highest porosity values for each trap type. Lowest average porosity was 24% in Type 5 traps, and the highest average porosity was 32% in Type 6 traps. Lowest porosity was 5% in Type 6 traps. Highest porosity was 9% in Type 7 traps.
Temperature, pressure
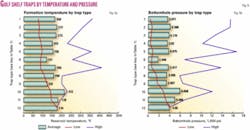
Fig. 5a shows the average formation temperature and low and high values for each trap type.
Some of the information released about formation temperatures is questionable. A reported temperature of 80° F. at a depth of 7,182 ft and a reported temperature of 83° F. at a depth of 10,289 ft are obviously incorrect.
The lowest average temperature was 121° F. in Type 6 traps, and the highest average temperature was 212° F. in Type 10. Lowest temperature was 80° F. in Type 1 traps, and highest temperature was 414° F. in Type 7 traps.
Fig. 5b shows the average, low, and high formation pressure values for each trap type. Lowest average formation pressure was 1,948 psi for Type 6, and the highest average formation pressure was 6,068 for Type 10 traps. Lowest formation pressure recorded was 520 psi in Type 4 traps. Highest formation pressure was 15,938 psi in Type 5 traps.
Water depth, saturation
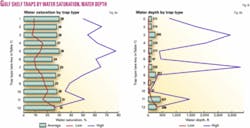
Fig. 6a shows the average water saturation and the low and high values for each trap type. Lowest average water saturation was 24% in Type 6 traps, and the highest average water saturation was 31% in Type 11 traps. Lowest water saturation was 7% in Type 3 traps. Highest water saturation was 78% in Type 4 traps.
Water depth has no effect on the type of trap but gives some indication of the location of traps in the Gulf of Mexico.
Fig. 6b shows the average water depth and low and high water depths by the type of trap found. Lowest average water depth was 37 ft in Type 10 traps, and highest average water depth was 421 ft in Type 11 traps. Lowest water depth was 3 ft in Type 1, 2, 4, 7, and 9 traps. Deepest water depth was 3,318 ft in Type 7 traps.
Although published data by trap type for different ages are limited, they do give a hint as to what to expect in reserves.
Traps of Pleistocene age had 42% of the oil reserves, traps of Pliocene age had 26% of the oil reserves, and traps of Miocene age had 32% of the oil reserves. Traps of Pleistocene age had 38% of the gas reserves, traps of Pliocene age had 11% of the gas reserves, traps of Miocene age had 44% of the gas reserves, and traps of Jurassic age had 5% of the gas reserves. Traps of Oligocene age had less than 1% of the gas reserves.
Reserves layout
Fig. 7 shows the distribution of oil reserves in each trap type by Pleistocene, Pliocene, and Miocene ages. Fig. 8 shows the distribution of gas reserves in each trap type by Pleistocene, Pliocene, and Miocene ages. These two figures give an idea of the importance of oil and gas production from each age and stress the prominence of Miocene reservoirs.
Fig. 9 shows the distribution of oil reserves in each trap type for each of the three main age groups. Largest trap types in the Pleistocene were Type 3 with 48% of the Pleistocene total oil reserves, followed by Type 1 traps with 12% of the Pleistocene oil reserves.
Largest Pliocene oil reserves, 69%, were in Type 3 traps, followed by 14% of the Pliocene oil reserves in Type 1 traps.
Largest Miocene oil reserves, 30% of the Miocene oil total, were in Type 3 traps, followed by 23% of the Miocene oil reserves in Type 1 traps.
No reserve data have been published about oil reserves in traps in formations of Oligocene or Jurassic age.
Fig. 10 shows the distribution of gas reserves in each type trap of the three age groups. Largest Pleistocene gas reserves, 31% of the Pleistocene gas total, were in Type 1 traps, followed by 27% in Type 3 traps.
Largest Pliocene gas reserves, 53% of the Pliocene gas reserves, were in Type 3 traps followed by 25% in Type 1 traps.
Largest Miocene gas reserves, 29% of the Miocene gas reserves were in Type 1 traps, followed by 28% in Type 2 traps.
Data analysis
Low values of depths and porosity tend to climb with increases in trap types from 1 to 11. Low values of pay thickness and areal extent tend to remain the same with increases in trap types from 1 to 11. High values of all four properties tend to decrease with changes in trap types from 1 to 11.
Average value of depths and areal extent tend to remain the same with changes in trap types from 1 to 11. Average pay thickness tends to increase and porosity values tend to decrease with changes in trap types from 1 to 11.
Highest values of water saturation and average water saturation tend to decrease as the trap numbers increase; lowest values of water saturation tend to increase as the trap number increases.
Highest water depths tend to decrease as the trap number increases; lowest and average water depths tend to increase as trap number increases. The only two property values that seem to make much difference in reserve sizes were pay thickness and productive acreage.
Largest Pleistocene, Pliocene, and Miocene oil reserves were in traps on salt or shale diapirs. Pliocene oil reserves were absent in traps in simple anticlines, permeability traps, and reverse faults. Miocene oil reserves were absent in traps in turtle structures.
Pleistocene gas reserves were absent in traps on reverse faults. Pliocene gas reserves were absent in traps on simple anticlines, permeability traps, and traps with reverse faults. Miocene gas reserves were absent in traps on turtle structures.
Most Pleistocene gas reserves were in traps with faulted anticlines followed by salt or shale traps on diapirs. Most Pliocene gas reserves were in faulted anticlines, followed by traps on normal faults.
Reference
- Bureau of Economic Geology, “Atlas of Northern Gulf of Mexico gas and oil reservoirs,” The University of Texas, Austin, 1999.
Bibliography
Haeberle, F.R., “Gulf of Mexico reservoir properties are helpful parameters for explorers,” OGJ, June 27, 205, pp. 34-37.
Haeberle, F.R., “Gulf hydrocarbon trap types provide exploration insights,” OGJ, Dec. 12, 2005, pp. 36-42.
Haeberle, F.R., “Gulf of Mexico reservoir properties can hint at expected reserve sizes,” OGJ, Aug. 28, 2006, pp. 29-35.
Minerals Management Service, “Estimated oil and gas reserves, Gulf of Mexico,” Report 2002-07, Dec. 31, 1999.
The author
F.R. Haeberle ([email protected]) is a consulting geologist who moved to Delaware, Ohio, after 20 years in Dallas. He has worked for Standard Oil Co. of Texas, Atlantic Refining Co., Mobil Oil Corp., Mayfair Minerals, and J.J. Lynn Oil Division. He holds BS and MS degrees in geology from Yale University and an MBA degree in finance from Columbia University Graduate Business School.
