PIPELINE FAILURE RATES-CONCLUSION: Pipeline grouping method improves aggregate data
This concluding part of an article exploring a model for reducing statistical uncertainty when pooling pipeline data applies Part 1’s methodology to actual pipeline-failure data compiled by the US Office of Pipeline Safety (OPS) 1994-2005. It also applies the methodology to estimate the failure rates in multiple onshore pipeline systems in Southern Mexico, for which failure data were gathered 1995-2004.
Pipeline reliability analyses struggle between the need to increase the number of km-years from which failure data are gathered in an effort to reduce statistical uncertainty and the need to avoid statistical uncertainties caused by pooling disparate data.
Part 1 of this article described a usable method for considering both the statistical and tolerance uncertainties of merged data to produce more accurate reliability predictions (OGJ, Sept. 25, 2006, p. 64).The methodology Part 1 outlined should be able to address failure processes with constant and time-dependent rates, test whether pooling of failure data across systems can occur, and reduce the statistical uncertainties in the estimation.
The primary pipeline attribute considered by this article is location of facilities. Future studies will analyze annual failure rates in terms of diameter, wall thickness, stress level, and age.
This article first applies Part 1’s methodology to pipeline failure data reported by the OPS. A homogeneous Poisson process [HPP] model calculates the average failure rates and confidence intervals, leading to the functional form (Power Law Process) of the failure intensity and identifying data that can be merged under both assumptions. The article will next apply the same procedure to the Mexican data.
System identification, statistics
The information reported by OPS identifies 10 clearly defined US systems according to location: 5 gas transmission pipeline systems in the southern region (S), southwest region (SW), western region (W), center region (C), and eastern region (E); and 5 oil transmission systems in the same regions. The states which comprise each of these systems can be determined from the OPS web page.1
This article focuses on two failure causes: external corrosion (EC) and third-party damage (TPD), two of the three leading causes of incidents in the US (along with internal corrosion; IC). TPD accounted for 308 incidents of a total 1,084 reportable incidents on US gas transmission and gathering systems 1985-97.2 EC accounted for 109 incidents in the same period, while reportable failure incidents from IC numbered 130.
The article focuses only on onshore pipelines, since offshore mileage is a minor fraction of the total reported by OPS. There are 288,388 miles of onshore transmission pipelines but only 8,101 miles of offshore transmission lines; 2.73% of the total.
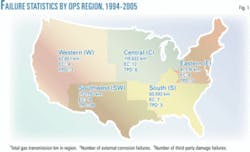
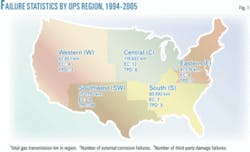
Fig. 1 shows the total number of failures in each region 1994-2005 for the two failure causes considered.
HPP estimates
Equation 1 estimates the average failure data for US pipelines. EC led to roughly 8 failures/million km-years, and TPD to about 1 failure/100,000 km-years. The breadth of the 95% confidence level of the estimated rates makes the statistical uncertainties in these estimates satisfactory.
The failure rates estimated by Kiefner et al. for incidents produced by external corrosion and third-party damage 1985-97 in gas transmission pipelines are similar.2 They found an estimated failure rate for external corrosion equal to 1.5× 10⁻⁵ km-year and a corresponding estimation for third-party damage of 4.2 × 10⁻⁵ km-year. Both failure causes allow postulation of a reduction in failure rate from one period to the other.
Applying the Fisher (F) test (Equation 2) to this case demonstrates that the data collected for these two time periods cannot be merged. The P-value associated with rejecting the null hypothesis H0: λ1 = λ2 is less than 0.1%, meaning that the reduction in the average failure rate with time is statistically significant at 95% confidence. Better operating and maintenance practices, changes in pipeline safety regulations, and new reporting criteria for incidents are among the possible explanations for this change.
NHPP analysis
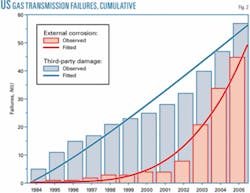
Incidents due to external corrosion reduce pipeline reliability. A nonhomogeneous Poisson process (NHPP) can model corrosion-related processes. Fig. 2 shows the relationship of the cumulative number of incidents to their years of occurrence for gas transmission pipelines. Data analysis suggests that failures produced by third-party damage have a constant failure rate, while external corrosion deteriorates the reliability of these pipelines.
Equation 3 fits the data to the law, and the 95% confidence for the calculated shape parameter β was calculated and then used to test the adequacy of the homogeneous Poisson process against the power law model (PLP). Equation 4 shows the final expressions for the cumulative number of failures for TPD and EC.
Formally applying the homogeneity test (Equation 5) to the data corroborates the trends observed in Fig. 2 and allows for rejection of the null hypothesis H0: β = 1 for external corrosion with α = 0.05. The null hypothesis cannot be rejected at the chosen significance level for TPD.
Strong evidence exists against the hypothesis that failures due to EC occur with constant failure rate, while the opposite holds true for TPD.
Merging assumptions
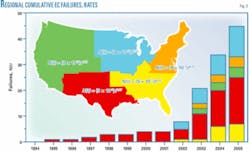
Assuming HPP, Equations 2, 6, and 7 test if data from different systems can be aggregated. The assumption that the five OPS systems follow NHPP determined the applicability of pooling their failure data. The time evolution of failures suggests that, regarding external corrosion, the five OPS regions suffer from deteriorating reliability with different trends. Fig. 3 checks the parameters of the power law process for the analyzed regions. The southwest region follows a different deteriorating process from the others.
Applying the homogeneity test and statistical test (Equation 5 and Equations 8-10) corroborates the gathered data formally. The null hypothesis, H0: β = 1, can be rejected for the five systems with a 5% confidence level (Table 1). The null hypothesis H0: β1 = β2=...β5 cannot be rejected at a 5% significance level (Equation 8), but the hypothesis H0: λ1 = λ2=...λ5 can be rejected at the chosen significance level. Doing so allows the failure rates of these systems to be treated as identical.
Data corroborated that failure rates due to TPF were improving in the southwest region but were steady in the other OPS regions.
OPS summary
External corrosion is deteriorating the reliability of onshore gas pipelines in the US, with different trends in the five OPS regions. Equation 11 describes the intensity function of the pooled data. Fig. 3 displays the intensity functions for each analyzed region.
Third-party damages show a constant failure rate for four of the five OPS regions, and growing reliability in the Southwest. Pooling failure data across OPS regions and gathering failure data from different time periods should be done with extreme caution.
Southern Mexico
Five systems are in place in Southern Mexico; two gas transmission pipeline systems, one managed by Operator A and the other managed by Operator B (AG and BG); two oil transmission systems (AO and BO) and one oil gathering system managed by Operator C (CO).
Four principal failure causes affect the systems:
- External corrosion (EC).
- Internal corrosion (IC).
- Mechanical damage (MD).
- Defective materials or bad construction practices (MC).
The category “other” (OT) captures all other failure causes.
Failures classifications include:
- Small leaks (SL).
- Large leaks (LL).
- Ruptures (RU).
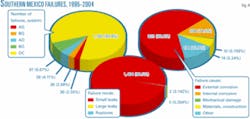
Fig. 4 shows the combined failure statistics of the five pipeline systems from 1995 to 2004. The largest number of incidents occurred in the OC system, making it an easy system to identity.
Fig. 4 also shows that most of the reported incidents were small leaks. Given this, and for the sake of simplification, the balance of this article will assess the failure data without regard to failure mode.
EC and IC (in that order) caused the largest number of pipeline incidents in the combined statistic. This also occurred in each of the identified systems.
Average failure rates
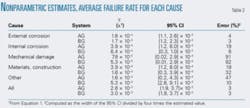
The assumption that the reported incidents follow homogeneous Poisson processes provided the basis for 1995-2004 average failure-rate estimates associated with the failure causes for the five systems. This stage of the analysis used Equations 1, 12, and 13, computing confidence intervals (CI) for a 5% significance level with the error of estimation. Table 2 shows the results of the estimations for the two gas systems (AG and BG).
In agreement with Fig. 4, corrosion-related incidents show the highest failure rate in these systems, while incidents due to mechanical damage show the lowest rate. MD, however, also has the largest statistical uncertainty, likely due to the small number of incidents reported for this cause during the observation period.
Table 2 gives failure-rate values larger than those previously published.2 3 The majority of the reported incidents studied here are small leaks, leading to larger failure rate values, while previous works focused on large leaks and ruptures.3 Table 2’s results allow identification of unreliable estimates as measured by the width of the prediction’s confidence intervals.
Examples of inaccurate estimates include those produced for mechanical damage in systems AG and BG.
Merging data
Under an assumption of an HPP, testing occurred at a 5% significance level for all failure causes. No reason exists to reject the hypothesis that the failure rates in both systems are equal for all failure causes.
The tests conducted for the oil pipeline systems, however, show that the failure data gathered cannot be aggregated, as doing so would produce a large tolerance uncertainty in the failure rate estimate for the merged data.
Testing the oil systems both in pairs and with all three together corroborated this result.
Merging the failure data gathered for these oil pipeline systems in an effort to reduce the statistical uncertainty of the failure rate estimation should be strongly discouraged because of the physical, environmental, and maintenance differences between these systems. Testing formally corroborated these differences, apparent from the beginning of the analysis. Merging the data will introduce a large tolerance uncertainty in the failure rate estimation of the merged datasets.
The results for gas pipeline systems, however, recommend merging the failure datasets. Doing so will reduce statistical uncertainty in estimating failure rates without introducing a significant tolerance uncertainty.
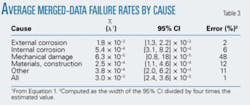
Table 3 shows average failure rate estimates for all the gas pipelines studied. Detailed comparison of these results with those given in Table 2 shows that, for all the failure causes, the error in estimating the corresponding failure rate diminishes for the merged data. The failure rate estimated for MD-related incidents, however, continues to have a large statistical uncertainty, with only two incidents for this cause reported in the merged data.
Power law model
Applying the data gathered in each system for failures caused by external and internal corrosion offered insight into the possibility that the power law model defined in Equation 3 could fit the corrosion-related failure data better than the homogeneous Poisson model. Equations 14 and 15 respectively produced the 95% confidence interval for the shape parameter β and tested the adequacy of the homogenous Poisson process against the power model.
Table 4 shows the results of this analysis, distinguishing the pipeline systems that follow a power law process from those that are best modeled by a homogeneous (stationary, with β = 1) Poisson process. The power law model allows corroboration of systems both in which maintenance has not been adequate to avoid reliability deterioration (β > 1) and in which maintenance has lead to reliability improvement (β < 1).
Fig. 5 shows the time evolution of the cumulative number of failures caused by external corrosion in the BG system. It also plots the intensity function for the AG system, which shows stationary behavior.
Table 4 also identifies the failure datasets that follow a power law process and could be merged following the methods outlined in Part 1 to reduce the statistical uncertainty associated with the estimation of the corresponding failure intensity function. Analysis of this information reveals that the only possibility is to test whether the failure data gathered in the gas pipeline systems for EC-caused incidents can be merged.
Equations 16 and 17 tested gas pipeline systems AG and BG (numbered 1 and 2, respectively). This computation scheme found N1(Texp) = 23, N2(Texp) = 32, and the experimental statistics Fβ = 0.91 (Equation 16), concluding that there are no arguments to reject the hypothesis that the shape parameters (β’s) are equal at the 5% significance level.
In a second step, Equation 17 investigated if the failure intensity function of the two systems could be assumed to follow the same power law. The value of the experimental statistic was found to be 0.36, leading to acceptance of the hypothesis that the failures caused by EC in the two gas pipelines systems follow the same power law process, with intensity (λ(t) = (4.4 × 10⁻⁴)t0.598)/km-year.
This prediction has a reduced statistical uncertainty for the failure caused by external corrosion in gas pipeline systems, as compared to Table 4.
Acknowledgments
The authors thank Hugo Huescas who gathered part of the failure data used in this work. They are also grateful to Petróleos Mexicanos (Pemex) for permission to publish these results.
References
- http://primis.phmsa.dot.gov
- Kiefner, F., Mesloh, R. E., and Kiefner, B. A., “Analysis of DOT Reportable Incidents for Gas Transmission and Gathering System Pipelines: 1985 Through 1997,” Pipeline Research Council International, Catalogue No. L51830E, 2001.
- Nessim, M., Zhou, W., Zhou, J., Rothwell, B., and McLamb, M., 2004, “Target Reliability Levels for Design and Assessment of onshore Natural Gas Pipelines,” International Pipeline Conference, Paper IPC04-0321, Calgary, Oct. 4-8, 2004.
