Gas from tight sands, shales a growing share of US supply
Tight gas sand and gas shale (along with coalbed methane) are today among the most active new natural gas plays in the US. While labeled as unconventional and still considered by many to be speculative, unreliable resources, today's tight gas sand and gas shale situation is quite positive:
- The majority of the largest domestic natural gas fields, measured by gas production or reserves, are tight gas sands or gas shales.
- The bulk of the giant gas discoveries of the 1990s have been from these two resource areas.
- Large undeveloped tight gas sand and gas shale resources still exist, which will increase with technology.
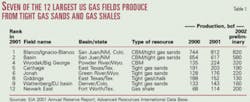
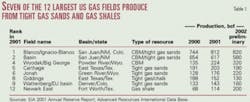
A measure of the growing importance of these gas resources is that tight gas sands and gas shales accounted for seven of the dozen largest US natural gas fields in terms of their 2001 production (Table 1).
- Combined natural gas production from the top two fields, Blanco/Ignacio-Blanco and Basin (San Juan basin), has remained relatively steady for the past three years, with the decline in Basin field countered by an increase at Ignacio-Blanco. The production volumes in these two fields include tight gas as well as coalbed methane.
- Jonah field (Green River basin) and Wattenberg field (DJ basin) show significant production increases, while the Giddings tight gas and chalk field in Texas has declined.
- Fastest growing has been Newark East field in the heart of the Barnett shale gas play in North Texas, where gas production has nearly tripled in the past 2 years.
Formation characteristics
The boundary between tight gas sands and conventional gas has become increasingly blurred as technology has emerged enabling this resource to be economically produced. Still, important distinctions remain:
1. Tight gas sands are low-permeability gas-bearing reservoirs (in a variety of rock types) that have an in situ permeability to gas of less than 0.1 md, exclusive of natural fracture permeability. The reservoirs are areally extensive, usually abnormally pressured, and often (but not always) found in basin-center settings.
2. Gas shales are self-sourcing reservoirs where a major portion of the gas resource is adsorbed on and within the organic matter in the shale. The reservoirs are abnormally pressured (usually underpressured) and require natural fractures for adequate flow paths.
Several features are common to tight gas sand and gas shale resources: First, these accumulations may contain large, even massive volumes of gas in-place, often at low concentrations; second, in spite of large gas in-place, only limited areas will have sufficient richness and permeability for commercial development; and, third, continued improvements in exploration and production technology, such as natural fracture detection, advanced reservoir diagnostics, and lower-cost well drilling and completion practices, are essential if these resources are to be effectively converted to reserves.
Status of reserves, resource
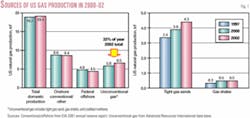
As conventional domestic onshore and offshore gas production has declined, tight gas sands and gas shales have helped fill the gap (Fig. 1).
Production
Natural gas production from tight gas sands and gas shales has increased steadily in recent years and now (along with coalbed methane) provided nearly 18 bcfd, or 6.5 tcf/year, equal to one-third of domestic production. This is up from 16 bcfd or 5.8 tcf/year just two years ago. Tight gas, with nearly 12 bcfd or 4.34 tcf/year is the dominant source, with gas shales providing over 1 bcfd or 0.52 tcf/year (Table 2).
The growth in tight gas sand production has been from discovery of new gas plays as well as more intense development of older plays.
- The Lance/Fox Hills tight gas sand play in the Greater Green River basin has grown to 660 MMcfd or 240 bcf/year in 2002, up from the less than 10 MMcfd five years ago.
- The Vicksburg tight gas play on the Gulf Coast of Texas has grown to 1.1 bcfd or 390 bcf/year in 2002, up from 8 MMcfd in 1997.
- The Cotton Valley/ Bossier tight gas sand play in East Texas has grown to 2.1 bcfd or 780 bcf/year in 2002, up from 1.8 bcfd in 1997. Production growth in the Bossier and Cotton Valley subplays has more than compensated for a decline in the Travis Peak subplay.
Meanwhile some of the older, traditional areas of tight gas sand development, such as the DJ Basin's tight sands (520 MMcfd in 2002), the Appalachian basin's Clinton/Medina sands (320 MMcfd), the San Juan Basin's Mesaverde sands (870 MMcfd), and the Anadarko basin's Cherokee/Red Fork sands (470 MMcfd), have maintained or even somewhat increased their gas production rates.
For gas shales, the Mississippian Barnett shale in the Fort Worth basin is the hot new story, with production of 550 MMcfd or 202 bcf/year in 2002, up from 80 MMcfd in 1997. Production growth in the Barnett shale has compensated for the sharp decline in gas production from the Antrim shale of the Michigan basin.
Proved reserves
The proved reserves of tight gas sands and gas shale have climbed along with their production.
After several years of modest growth, tight gas sand and gas shale reserves have increased significantly in the past two years (Table 2). Recent multi-tcf discoveries and rediscoveries in the Cotton Valley/ Bossier tight sands of East Texas, intensive drilling of Mesaverde (Williams Fork) tight sands in the Piceance basin, the pursuit of Lance tight gas sands in the Northwestern Greater Green River basin, and the development of the Wilcox/Lobo and Vicksburg tight gas sands in the Gulf Coast account for the bulk of the reserve growth. Today's proved natural gas reserves of 187 tcf contain 54 tcf of tight gas sands and about 8 tcf of gas shales.
Resources
Approximately 339 tcf of technically recoverable tight gas sand resource and another 48 tcf of gas shale resource remains undeveloped or undiscovered.
With progress in exploration, reservoir characterization, and drilling/completion technologies, these resource volumes are estimated to increase, by about 124 tcf for tight gas sands and 20 tcf for gas shales (Table 3).
Winning technologies
Five technologies have emerged as being central to successful tight gas sand and gas shale development, namely:
1. Exploration technology for establishing the higher permeability, naturally fractured areas of a tight gas basin or play.
2. Basin and regional studies to understand and avoid high water saturation areas.
3. Reservoir characterization to establish the total productive pay intersected by a wellbore.
4. Emphasis on steadily driving down well drilling and completion costs.
5. Applying intensive resource development.
The benefits of adopting two of these technologies—applying natural fracture exploration technology and reducing drilling and completion costs—are further illustrated below. The subsequent case studies, particularly Case Study 1 on the tight gas development in the southern Piceance basin, will illustrate the concept of intensive resource development.
Natural fracture exploration
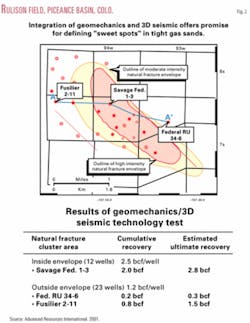
A major DOE/NETL-sponsored natural fracture exploration R&D project was conducted by Barrett Resources (now Williams RMT) and Advanced Resources International in the Williams Fork tight sands of Rulison field, Colo.
The project, using a combination of 3D seismic, basin analysis, and a geomechanical stress model, identified a natural fracture cluster area (a permeability "sweet spot") that covers three sections in the southern portion of Rulison field.
Wells drilled in this "sweet spot" area of southern Rulison field have reserves two or more times higher than reserves of wells drilled outside this area (Fig. 2).
Drilling-completion costs
After acquiring Overton field, a Cotton Valley tight gas sand reservoir in East Texas, Southwestern Energy undertook a focused program to reduce well drilling and completion costs.
At the heart of the program was the goal of reducing drilling time for these 12,000-ft deep wells.
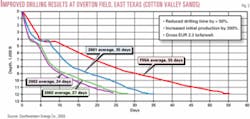
Through a combination of detailed characterization of the rock sequence, optimizing drilling bits, use of newer rigs, and providing performance incentives to the drilling crew, Southwestern Energy has been able to reduce average drilling time by more than 50%, significantly reducing cost per well (Fig. 3).
Case studies of technology progress
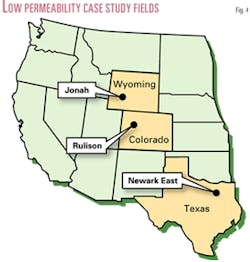
Three case studies help illustrate how technology, in aggregate, has changed the performance and costs of today's tight gas sand and gas shale plays (Fig. 4).
Case Study No. 1 Piceance basin, Colorado
Background
The Piceance basin contains a thick package of vertically stacked, lenticular sands in the Williams Fork/Mesaverde formation.
These tight gas sands contain an impressive volume of gas in-place, estimated at 300+ tcf.1 2 Until recently, these sands were thought to be low productivity, high cost resources.
Regional geologic studies and detailed reservoir characterization at DOE's Multiwell Experiment (MWX)/ Rulison field site were instrumental in changing this outlook. These studies demonstrated that the basin-center Williams Fork formation is widely gas charged and can be successfully developed in areas where thick, stacked sands and natural fractures coexist.
Following earlier discovery and subsequent abandonment of the play, the redevelopment of the Williams Fork/Mesaverde began in the mid-1990s and has continued strong through today.
Currently, 1,092 active wells produce 288 MMcfd, with 216 of these wells drilled in 2002 and early 2003. To date, the Williams Fork formation in this basin area has produced over 500 bcf of gas from Rulison, Grand Valley/Parachute, and Mamm Creek fields and is headed toward a multi-tcf natural gas play (Table 4).
Technology progress
Gas recovery per well. This is the single most important technology progress measure for tight gas sands.
Application of advanced well logging practices, lower-damage well completions, and higher efficiency hydraulic fracturing technology have led to progressive improvements in well performance.
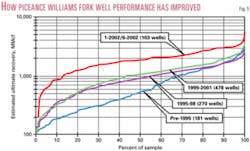
Fig. 5 provides the distribution in well performance for this gas play for four key time periods, including the active well drilling during the first half of 2002. The analysis shows that the mean estimated ultimate recovery per well has improved steadily from 0.79 bcf for pre-1995 wells to 1.98 bcf for recent wells. At the same time, the dry hole rate has declined from 9% for the pre-1995 wells to essentially zero.
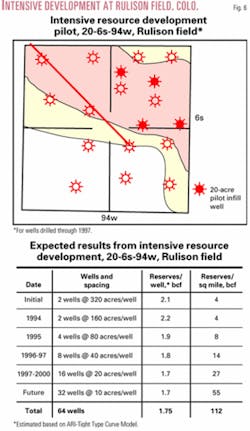
Intensive resource development. An active program of intensive infill development is under way for these tight gas sands. In 20-6s-94w, one square mile of Rulison field, the operator has completed its 20-acre/well (32 wells/sq mile) well spacing pilot.
Subsequently, the field operator has applied for and has begun an even more intensive development at 10 acres/well.
The results of this pilot have been encouraging and indicate little or no impairment in gas recoveries per well. Assuming initial well production rates are valid indications of long-term performance, this one square mile by itself would provide over 100 bcf of ultimate gas recovery (Fig. 6).
Summary
The combined application of improved technology and intensive resource development is converting the originally assumed modest and marginal gas 100 bcf Williams Fork formation tight gas prospect in the southern Piceance basin into a major multi-tcf natural gas accumulation (Table 5).
Case study No. 2 Green River basin, Wyoming
The Greater Green River basin (GGRB) is the dominant natural gas producing basin in the Rocky Mountains.
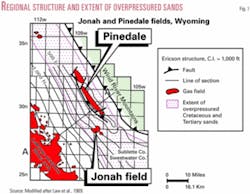
The natural gas in this basin occurs in numerous Tertiary and Cretaceous-age formations. Recently, the Lance formation has emerged as a significant producing horizon, particularly at the Jonah and Pinedale field areas. Fig. 7 shows the regional structure and extent of overpressured Cretaceous tight sands in the northwestern portion of the basin.
Historical review
Jonah field was discovered in 1975 but remained undeveloped for nearly 20 years.
Recompletion of one of the original wells, the 32-34 Jonah, and the drilling of a new well, the 1-5 Jonah Federal (in 5-28n-108w), established commercial rates of gas production in 1992, sparking the gas play.
Before 1992, completion attempts employed small amounts of proppant (100,000 to 200,000 lb) and either cross-linked water-based gel or CO2 foam as the transport fluid. These attempts failed to establish commercial production due to damaging or ineffective fracturing fluids and poor placement of proppant.
Beginning in 1994, the field operator began using water-based fluids with borate cross-linkers and a modified perforation technique designed for flexible treatment of multiple intervals. This new approach provided improved lateral and vertical proppant placement, leading to improved reserves. Estimated ultimate gas recoveries for wells treated with this approach are 5-10 bcf/well, with initial gas production rates of 5-7 MMcfd.
Resource concentration
Jonah field area holds a rich, 250-300 bcf/sq mile concentration of natural gas, leading to nearly 10 tcf in place for this 36-sq-mile sized field.
A unique geologic setting, involving the local uplift of the overpressured Lance section and a series of lateral sealing faults, has enabled gas to become trapped in the Jonah field area, creating this rich gas accumulation.
Current development
As of mid-2003, Jonah field is the largest natural gas field in the GGRB in terms of production.
It produces 670 MMcfd from 484 wells, having steadily increased for the past five years. To date, the field has produced over 800 bcf and is well on its way to becoming a multi-tcf giant gas field.
Jonah's evolution
Aggressive vertical completion of the full stack of gas charged net pay in the Lance formation has converted Jonah field from a bypassed area with low productivity wells to a highly productive giant gas field.
The realization that past pay selection procedures were inadequate and that past well stimulation practices were damaging led to significant changes in well completion practices (Table 6). The current practice is to attempt to link a well to as much of the vertical net pay as possible, using 10 or more completions and stimulations per well.
Recently, the area has begun to be developed on 40 acre spacing, with indications of using even closer well spacing. As such, Jonah field area is rapidly adding intensive areal resource development to its already successful intensive vertical resource development strategy.
Case Study No. 3, Fort Worth basin, Texas
The Fort Worth basin holds the Mississippian-age Barnett shale, an organically rich, low-permeability gas accumulation.
These gas shales are estimated to hold 120 tcf of gas in-place, based on recent estimates prepared by Devon Energy Corp., Oklahoma City.
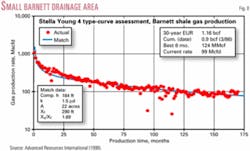
The USGS provided the initial resource assessments for the Barnett shale, estimating its technically recoverable resource at a modest 1-3 tcf. A subsequent joint Advanced Resources and USGS study3 updated this resource estimate to 10 tcf based on establishing the very limited drainage being achieved by wells in this gas play (Fig. 8).
Natural gas development
Development of the Barnett shale began in the mid-1980s in Newark East field.
Development progressed slowly as the early wells had low reserves, with an occasional high productivity well.
With steadily improving performance starting in the mid-1990s, drilling in the Barnett shale accelerated. Today, nearly 1,800 wells have been drilled into the Barnett shale, with gas production reaching 550 MMcfd and recovery of over 600 bcf (Table 7).
Technology progress
Gas recovery per well. Gas recovery per well has steadily improved as operators have changed their well completion practices by completing a larger portion of the shale interval (adding the Upper Barnett zone to the Lower Barnett zone), by introducing more effective (and lower cost) "light sand frac" technology, and by refracturing previously completed wells.
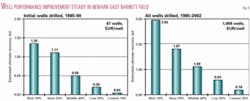
These technologies have enabled well performance to improve steadily from an average of 0.5 bcf for the 87 initial wells to 1.1 bcf for all wells drilled to date (Fig. 9).
Resource growth. The size of the Barnett shale gas resource, now estimated at 20 tcf recoverable, has steadily increased as the understanding of this gas play has grown, as well performance has improved, and as the field has been more intensely developed.
Improved drilling and completion. Improved drilling and completion practices helped reduce overall well drilling and completion costs in the late 1990s. While increasing rig day rates drove costs up in 2001 to nearly $900,000/ well, improvements in rig efficiency and lower infrastructure costs for infill wells are, once again, enabling drilling and completion costs to decline to $750,000/well.
Horizontal drilling is also starting to be applied in the Barnett shale. The horizontal wells drilled to date have initial flow rates two to four times of a vertical well, with costs about two times a vertical well. Devon has announced that it would drill 50 horizontal wells into the Barnett shale in 2003, with seven horizontal wells already on line and producing an aggregate 15 MMcfd.
Summary
The overall progress in Barnett shale development technology, including improved well performance, lower costs, and intense resource development, may (as claimed by the operator) enable the Newark East field to become one of the largest gas fields in Texas:
1. Reserves per well have steadily increased from about 0.5 bcf/well initially to 1.25 bcf/well for recent wells and could reach 2 bcf once the full impact of the refrac program is realized.
2. Finding and development costs have declined from a range of $1.50-$2.00/Mcf for the initial wells to about $0.75/Mcf for recent wells.
Closing observations
In reading this "status report" on tight gas sands and gas shales, it is useful to keep four observations in mind.
1. Today's outlook for these two gas resources represents only a "snapshot in time."
2. We do not yet know the ultimate size or productivity of the tight gas sand and gas shale resources.
3. Improved geologic knowledge will continue to expand this size by adding new gas plays.
4. Technology progress will help increase recovery from and expand the size of the already defined plays.
References
1. Johnson, R.C., "An Assessment of Gas Resources in Low-Permeability Sandstones of the Upper Cretaceous Mesaverde Group, Piceance Basin, Colorado," USGS Open-File Report 87-357, 1987.
2. Kuuskraa, V.A. and others, "Portfolio of Emerging Natural Gas Resources, Rocky Mountain Basins, Section 2: Piceance Basin and Section 3: Wind River Basin," Gas Research Institute, April 1999.
3. Kuuskraa, V.A., Koperna, G., Schmoker, J.W., and Quinn, J.C., "Barnett shale rising star in Fort Worth basin," OGJ, May 25, 1998, pp. 67-76.
Bibliography
Law, B.E., and C.W. Spencer, eds., "Geology of tight gas reservoirs in the Pinedale anticline area, Wyoming, and at the multiwell experiment site, Colorado," US Geological Survey Bull. 1886, 1989.
"U.S. Crude Oil, Natural Gas, and Natural Gas Liquid Reserves," Advance Summary, 2002 Annual Report, Energy Information Administration, DOE/EIA-0216 (2002) Advance Summary, October 2003.
The authors
Vello A. Kuuskraa (vkuuskraa @adv-res.com) is president of Advanced Resources International, a firm that provides technical and consulting services in geology, engineering, and economics for natural gas and oil. He served on the US Secretary of Energy's "Assessment of the U.S. Natural Gas Resource Base" and was a member of the National Academy of Sciences' Committee on the National Energy Modeling System. He received an MBA degree (highest distinction) from the Wharton School, University of Pennsylvania, and a BS degree in mathematics/economics from North Carolina State University.
Gregory Bank is a geologist with ARI. He has worked on unconventional gas play assessments throughout the Rocky Mountains. He has an MS in geology from Virginia Tech and a BSc from Washington & Lee University.
