Assessing long-term fundamentals for natural gas supports higher-price outlook
An outlook for natural gas usage and prices in North America must start with analysis of demand and competing fuels.
Many users of natural gas also can be satisfied by other fuels, such as residual fuel oil or distillate. The relationship of demand and these competing fuels exercise substantial influence on natural gas prices, which, in turn, encourages or discourages natural gas drilling activity and subsequent supply.
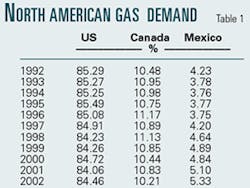
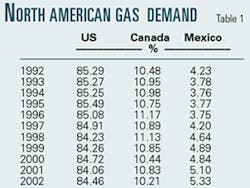
Over the past decade and expected into the future, the US is the predominant consumer of natural gas in North America. Table 1 clearly shows that the US has consistently stayed near 85% for its share of all North American gas consumed. Understanding and forecasting the US market will set the stage for all of North America.
Gas demand breakdown
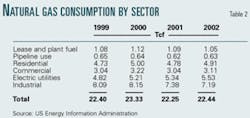
Natural gas demand can be broken down into several sectors tracked by the US Department of Energy's Energy Information Administration. Table 2, which shows natural gas consumption by sector, reflects the usage definitions of the EIA and a demand response to high natural gas prices.
The first two categories of usage are part of the production and transportation infrastructure of the natural gas industry. Lease and plant fuel for operating separators, wellhead compression, liquids stripping, and dehydration will show flat demand growth or at best grow with production volumes. Pipeline use entails running compressors to sustain pipeline pressures and should also see flat demand with growth only in line with increased throughput.
Residential volumes are for space heating of private homes. Coal furnaces are long gone, and electric-resistance heat is generally inefficient and expensive. Fuel oil is still used in the US Northeast, but it too is generally in decline. Natural gas usage for residential demand should grow at the same rate as population rates, perhaps modestly faster as home sizes increase and fuel oil is displaced. Weather volatility—expressed as heating degree days (HDDs) or cooling degree days (CDDs)—is the major demand variant and should be assumed to be normal.
Natural gas demand under the commercial heading is consumption by retail commerce, schools, apartment buildings, hospitals, and other nonindustrial demand. This sector is influenced by economic activity, but at a more stable pace. Product manufacturers may be variable with the economy, but the shopping mall keeps regular hours.
These slow-growth components of gas demand total roughly 42-43% of total demand over the past 5 years. Their influence is reflected in annual totals that appear to indicate nearly flat demand. However, the last two sectors of natural gas demand in Table 2 show several trends that are interesting. In response to higher prices, electric utilities have decreased their natural gas consumption, but consumption by independent power generation has grown. Although clearly price-sensitive, industrial usage of natural gas has held up well despite the weak economy. These two areas require additional analysis.
A review of electric utility generation starts with a comparison of fuel mix used for generation (Table 3). There are several meaningful points to be made here.
First, the utilization of nuclear load has increased substantially, and, while further increases are possible, the magnitude of past increases cannot be repeated. Nuclear will start lagging as a competitor to natural gas unless new plants or expansions are authorized. Coal, which has grown at a slowing rate, largely backed out oil products as a fuel source, not natural gas. In fact, for all the reports of usage swing between residual fuel oil and natural gas, the demand concern in the electric utility sector is growing competition with distillate. Note that 2002 magnified the decline in fossil fuels as hydropower increased 23%, and overall electric utility generation was down by more than 3%.
Since distillate is a more expensive product than residual fuel oil, it is counterintuitive that it would compete with natural gas. Still, the lower pollution yield of distillate vs. residual fuel oil compresses the cost difference. In addition, the recent higher price of natural gas reached a level where not only residual fuel oil but distillate was price-competitive. The growth of fuels arbitrage and marketing as a part of "energy marketing" in the recent past also increased contract availability, which allowed more-efficient
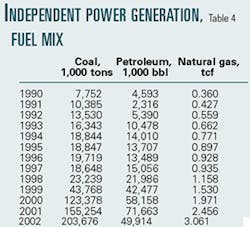
usage at points in time to be locked into contract for longer timeframes. Electric utility power generation, though, is not the growth story for electricity or generation fuels. The nonutility power producers are the "hot" area, capturing weather-induced load volatility that utility base plants are not designed to handle. The distributed-generation theme and the independent power producer story are both captured within nonutility power producers. This area is the growth story of natural gas demand (Table 4).
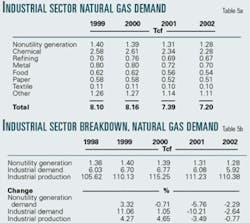
The growth here is obvious as compared with electric utility power generation. The issue will be if the nonutility growth has run its course with electricity deregulation being second-guessed and the collapse of funding, or even survival, of some of the rapid-growth companies in this arena, notably Dynegy Inc., Calpine Corp., and other power marketers. This independent power generation sector is separate from onsite distributed power generation that is included with industrial load. Power generation in total, combined with industrial usage, is over 50% of demand and remains the most promising area for growth, showing strength despite economic weakness of the industrial base and financial difficulties of independent power generators. A further breakdown of natural gas consumption by the industrial sector is instructive (Table 5). The industry breakdown is estimated from EIA historic data but not confirmed.
Forecasting gas demand
Forecasting future natural gas demand will be dependent upon the recovery in industrial activity and the pace of demand for nonutility generation. In assessing this relationship, we can use actual changes and index numbers in Table 5b.
The relationship demonstrates that natural gas demand fell in 2000-02 in relationship to industrial activity. This is the same timeframe where earlier data indicated that distillate backed out natural gas in electric utility generation. According to EIA records, 2000-01 witnessed distillate increases stronger than in any earlier 2-year period, and at 275,000 b/d was the equivalent of 1.65 bcfd of lost natural gas demand. During the same time, residual fuel oil consumption rose in 2000, fell in 2001, and was down over the period. A lesson here is that residual fuel oil will always compete as it has historically, but when natural gas crosses the threshold of pricing with distillate, market share is tenuous.
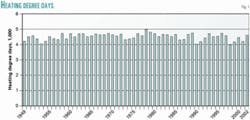
Using the preceding analysis, we can build a forecast of future gas demand, competition, and pricing. Starting with the stable areas of lease, plant, and pipeline usage, there is very little change, just variations in line with pipeline growth, compressor cost control, etc. The more meaningful, but still stable, area is residential usage for space heating and cooling. The determinants here are population growth, market share against fuel oil (limited mostly to Northeast and Mid-Atlantic regions), and variability of weather. The future outlook for weather is always assumed to be normal over time, with hedging and/or weather insurance used at specific near-term forecast points. Over the past 50 years, HDDs and CDDs have been stable; with HDDs counting roughly double the gas usage of CDDs, as shown in Figs. 1-2.
Assuming weather stability, residential demand should match population growth at 1.5%/year. The market-share gains natural gas will take from heating oil are likely to be offset by the population shift to warmer-climate states, and the aforementioned fact that cooling load uses less natural gas than heating load. Commercial demand has been historically stable, reflecting variability with the economy. This forecast expects 2% economic growth in 2003 and 3% thereafter. Looking at the demand forecast of the stable sectors, the future picture for natural gas consumption is for relatively modest growth, as would be expected (Table 6).
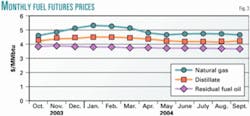
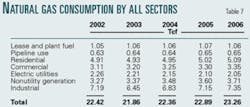
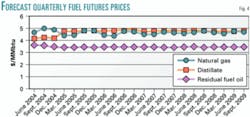
The forecast for the remaining two sectors, the power generation and the industrial load, will encompass the dynamics of competing fuels and cost structure as dominant influences (Table 7). As seen in Fig. 3, the current high price of oil keeps distillate at a healthy level on the forward curve and tracking with natural gas, while residual fuel oil is less expensive. Accordingly, from earlier research, the expectation would be that electric utility power generation will shift demand in favor of residual fuel oil. However, with independent power producers and the nonutility generation of the industrial base, natural gas, at its high price, competes with distillate as well as residual fuel oil.
The next year should continue to see gas demand weakening as it is backed out of electric utility generation, and nonutility generation and the industrial economy remain less than robust. However, when the economy recovers, natural gas demand could remain weak, as demand would shift to distillate.
In the longer term, natural gas appears to be pricing against distillate, although once again is unable to compete effectively against residual fuel oil. Therefore, in assessing natural gas demand going forward, the crucial points to monitor are becoming quite clear. First, electric utility demand should continue to disappear as residual fuel oil takes that market. However, independent power generation, once assumed to belong to natural gas, could become a battlefield of competing fuels where dual fuels are possible. The same could happen with industrial demand. The caveat on industrial demand, and by derived influence nonutility generation, will be the absolute price level, not competing fuels. Does some energy-intensive heavy industry simply leave North America?
A second point will be the temperature spikes for peaking units with the independent power producers. Natural gas should be subject to highly variable demand load for peakers. In this arena, unlike residential demand, CDDs do not matter; it is the absolute high peak in demand that brings the gas-fired peakers into play. A hot summer overall may or may not impact gas demand (recall load loss in utility generation). But sharp peaks in temperature past the capacity of the electric utilities will be substantially met with gas consumption for peak generation.
Looking forward on the competitive position of natural gas for the last two sectors, electric utility generation, and industrial usage (including nonutility generation), the price comparison shown in Fig. 4 is crucial. It clearly shows that residual fuel oil should hold or gain market share, while distillate and gas compete more closely. Recalling the improved utilization for nuclear and the declining growth rate for coal, electric utility generation should trend toward residual fuel oil.
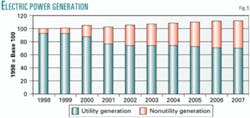
Fig. 5 shows that while electricity generation is increasing, the load is shifting from the traditional utility generator to the new independent power and/or distributed-power generator. As nonutility electric generation is responsible for over 60% of natural gas used in power generation, the fundamentals should continue to show overall gas demand for generation increasing. An issue that will grow is the improved heat rate of new turbines vs. older equipment. Accordingly, the increase in actual gas consumption will not move in lockstep with natural gas share of nonutility generation.
The last sector to forecast demand for natural gas entails industrial load other than nonutility power. This truly cyclic sector will be influenced by the economy and competitive cost structure, both against foreign and domestic competitors. This, of course, reflects back onto demand for natural gas.
Competing fuels
In terms of competition, natural gas is still facing hurdles, just somewhat different than in the past decade. Again, natural gas in the cost structure of some heavy industry could face losses as industry moves to lower-cost regions of the world, or in turn loses global market share from cost pass-through pricing. This is embedded in the forecast shown in Table 8, wherein weaker demand than consensus (reflecting high price) shows up in nonutility generation and industrial sectors. The often quoted 30 tcf economy of 2010 looks more likely to be a 26-27 tcf economy, with supply and demand balanced through higher natural gas prices.
Gas-on-gas competition could still be a problem. The expected loss of electric utility market share due to price could displace gas in competition in other markets, and as the industry adjusts to higher price levels, more discoveries and monetization of remote or flared gas increases in likelihood.
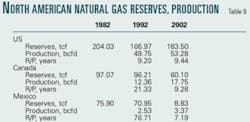
However, the reserve base and production numbers clearly indicate that the US will continue to be a significant importer of natural gas (Table 9). The US share of North American reserves is over 70% and in decline. A troubling trend is also showing that total North American reserves have declined in the last 20 years, and the reserve life is falling. (In 2002, Mexico revised its reserve definition of proven to conform to US standards for defining reserves that are economically producible at current conditions.)
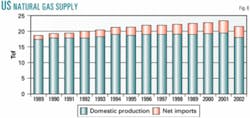
The maturity of the US reserve base is revealed by its production of the past several years. Fig. 6, depicting US natural gas supply trends, indicates that while higher prices of recent years and rising demand have increased domestic production modestly, it has been imports that have met the increased demand.
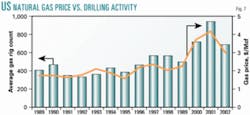
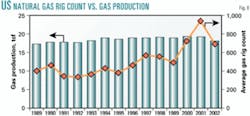
The lower reserve base is also shifting, with more coalbed methane (smaller reserves per well) included, and a greater reliance on rapidly declining Gulf of Mexico wells than in the past. It could be argued that the quality of the reserve base is lower today and reflects less-promising major exploration plays than in the past. This can also be shown by demonstrating that higher prices and greater drilling activity have not yielded commensurate production. Fig. 7 shows that drilling activity has followed changes in the natural gas price. Actual production volumes, though, have not been of the magnitude that one would expect to accompany the increase in drilling activity. Notice that in Fig. 8 the same rise in natural gas rig count that moved with natural gas prices elicited only modest additional volumes. The natural gas rig count increased from an annual average of 406 in 1989-91 to an average of 712 in 1999-2002, a rise of 75%. Production volumes from this increase in activity rose only by a disappointing 6.9%.
In 2002, the number of drilling rigs actively in search of natural gas fell sharply, to only 691 from the 2001 peak of 939 rigs. If the substantial increase in rigs achieved only a modest production response, the decrease in rig count likely foretells of declining volumes, which was, in fact, the result in 2002. Fortunately, initial surveys of intended natural gas drilling for 2003 reflect the higher price of natural gas, and the rig count is rising meaningfully, with US gas rigs at 910 drilling, up 29% from 704 rigs drilling at this time last year.
The Independent Operators' survey from American Oil & Gas Reporter and attendant questions of influencing factors and favored technology are enlightening. Among the survey responses is a projected 22% increase in number of gas wells planned for 2003 over 2002. The price sensitivity is also favorable, as respondents indicated staying power on the forecast activity down to a $2.50/Mcf level. Conversely, the 22% projected increase in gas wells incorporates a price forecast of $3.24/Mcf and the magnitude of increase rises substantially as gas prices exceed that forecast, with $4.25/Mcf as a level that jumpstarts more funding.
Indeed, US operators in first quarter 2003 logged a 30% jump in drilling permits and a nearly 25% increase in the rig count. An improved rig count this year and next should be helpful in improving the outlook for production volumes. We can calculate such a production profile if we assess the increase in drilling activity, look at rig efficiency, and study decline curves on existing production.
(Author's note: rig efficiency and decline curves used in forecasting production are from proprietary work and data done by CSW Corp. over several years of actual in-field results.)
Outlook
The price of natural gas appears to have made another step up relative to the past and could effectively trade at $3.50-4.50/Mcf for a number of years. Point estimates of price competition are $23/bbl oil, $3.25/Mcfe residual fuel oil, $4.45/Mcfe distillate, and $3.85/Mcf for natural gas.
This price structure is capable of balancing the market as shown by the research in this article. There will, of course, be substantial volatility and price spikes and collapse based upon weather, news, and speculation, but the fundamental average or mean-reverting price structure should be roughly as outlined.
Currently, both oil and natural gas are substantially above these price points, reflecting uncertainty in global conditions and markets, and confusion regarding the change in price levels. The market is pricing a "shortage," whichwill ultimately manifest in rationalization of the new higher-price deck outlined here.
The author
Gregory J. Winneke ([email protected]) is CEO and founder of CSW Corp., based in San Antonio, a consultancy he has operated since 1987. He consults to the oil and gas industry on price outlook and property management and acquisition and management of producing and nonproducing oil and gas properties. He also supervises or performs land, title, division order, engineering, and accounting on more than 150 producing wells. Previously, Winneke was a senior equity security analyst with USAA Investment Management Co. in San Antonio, from July 1994 to July 2002. Prior to that he was an investment analyst or portfolio manager for the State of Wisconsin Investment Board for stints in 1983-87 and 1993-94; senior investment analyst, energy, with O'Connor & Associates, Chicago Board of Trade, during 1987-89; and an investment analyst with National Bank of Detroit during 1980-83. Winneke is a member of a number of investment analysts' and oil industry trade associations. He holds a BS in business administration from Morningside College and an MS in finance and investments from the University of Wisconsin at Madison. He is a chartered financial analyst and a certified minerals manager.
