Bakken's maximum potential oil production rate explored
James Mason
Energy consultant
Farmingdale, NY
North Dakota began producing oil in 1951, and production in the late 1970s reached 100,000 b/d where it remained until the early 2000s.
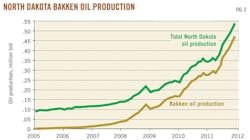
With the advent of advanced horizontal drilling and hydrofracturing technology and high oil prices, E&P companies began to focus on unlocking the extensive North Dakota Bakken formation in the early 2000s. The result is a dramatic increase in oil production. In late 2011, North Dakota oil production exceeded 500,000 b/d.
What is the maximum oil production rate to be expected for the North Dakota Bakken?
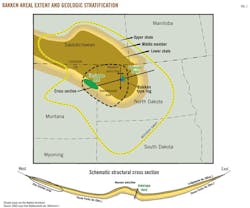
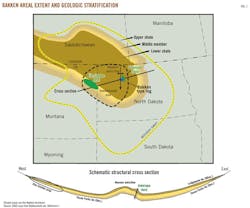
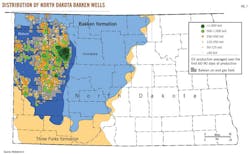
The Bakken formation lies in the Williston basin, an ancient seabed, and extends over parts of North Dakota, Montana, and Saskatchewan (Fig. 1).
A conservative estimate of oil in place in the Bakken is 300 billion bbl, but it is locked in low permeability rock.2 Continental Resources Inc. places the quantity of recoverable oil in the US Bakken at as much as 24.3 billion bbl.4 5
Horizontal drilling and hydrofracturing make commercial scale oil production possible. Horizontal wells are drilled into the Middle Bakken and the underlying Three Forks reservoirs, and hydrofracturing creates pathways for the flow of oil from these reservoirs and possibly the upper and lower members of the Bakken Formation.3
The issue explored in this article is the maximum oil production rate of the North Dakota portion of the Bakken oil formation. Three oil production rates for 2020 are evaluated: 1 million b/d, 1.5 million b/d, and 2 million b/d. This information is important because of tightening world liquid fuels supply/demand balances and increasing price volatility.
The organization of the article is as follows.
First, a North Dakota Bakken oil production and well development history for 2005-11 and an average well production profile are constructed using well data compiled by the Oil and Gas Division of the North Dakota Department of Mineral Resources.
Second, Continental Resources' land area, average well production rate, and well development assumptions for its Bakken recoverable oil estimates are reviewed and applied to the North Dakota Bakken oil production analysis.4
Third, the well counts required to achieve and sustain the three oil production rates are calculated.
Fourth, the well counts are used to estimate the year when well saturation of the North Dakota Bakken land area occurs. The timing of well saturation of the Bakken land area is used to evaluate the sustainability of the three oil production rates.
The study concludes with a brief discussion of the findings.
Bakken oil production growth
Oil production in the North Dakota portion of the Bakken has increased from 3,000 b/d in 2005 to over 400,000 b/d in 2011 (Fig. 2).
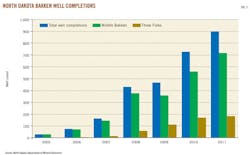
In 2011, Bakken oil production was 87% of total North Dakota oil production. The increase in annual oil production is related to the annual number of well completions. The number of annual well completions 2005-11 is presented (Fig. 3). Over 99% of the wells being drilled in the Bakken are horizontal wells. If the 2010-11 pace of well development continues and average well production holds, then North Dakota Bakken oil production reaches 1 million b/d in 2018.
Horizontal wells are being drilled in two tight sandy, dolomitic and silty strata—Middle Bakken and Three Forks. These geologic strata are shown in the schematic structural cross section of the Bakken formation at the bottom of Fig. 1. For a good description of the petroleum properties of the various geologic strata of the North Dakota Bakken refer to Nordeng's report for the North Dakota Geological Survey.3 The Middle Bakken is shallower and is being exploited to a greater extent than the deeper Three Forks. Complete well development is believed to be four wells/sq mile: two wells in the Middle Bakken and two wells in the Three Forks.4
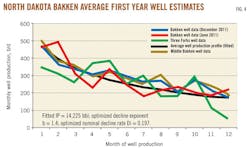
First year average monthly well production totals are presented in Fig. 4 for Middle Bakken and Three Forks wells. Also in Fig. 4 are the combined well totals for the two well production samples; one using data through June 2011 and the other using data through December 2011. The format of the well data is cumulative oil production for the number of well production days. This reporting format precludes compilation of a monthly well production history for all wells.
The first year average monthly well production totals presented in Fig. 4 are for those wells that have a reported cumulative number of production days within a 10-day range for each month of the year. Since a relatively small number of wells is used to generate the first year average monthly well production totals, well production totals are taken for two data periods, one for well data through June 2011 and the second for well data through December 2011. This provides two independent samples of first year average monthly well production totals.
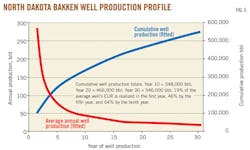
The first year average well production profile in Fig. 4 and the corresponding 30-year average well production profile in Fig. 5 are estimated by fitting a 30-year, hyperbolic curve to the sample first year well production data. The hyperbolic curve formula is:
qt = qi/(1 + b Di t)1/b
where
qt = production in month t
qip = initial production (first full-month
production)
b = decline exponent
Di = nominal decline rate
t = time in month of production
The first full month initial production rate, qip, the decline exponent, b, and the nominal decline rate, Di, are unknowns and are estimated by minimizing the squared differences between the fitted data points and the data points for the two well production samples.
The minimization calculation is constrained by the following assumptions: an initial production rate of 14,225 bbl for the first full month of production; a decline exponent ranging in value from 1.1 to 1.4, and a nominal decline rate (Di) ranging in value from 0.1 to 0.3. The best fit, 30-year, average well production profile has an estimated ultimate recovery (EUR) of 546,000 bbl.
Continental Resources' calculations
In 2010, Continental Resources estimated the quantity of recoverable oil in the US Bakken. Its estimate is derived from available land area, geologic oil generation criteria, well spacing assumptions, and an average well production profile.
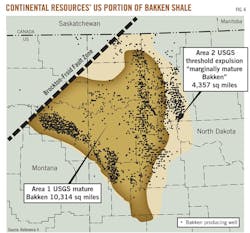
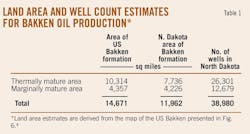
The average well production profile is based on an EUR of 500,000 bbl/well, which is realistic based on the average well production profile estimated from sample data above. Land area estimates are presented in Table 1 and Fig. 6.4
The Bakken is partitioned into a thermally mature area and a marginally mature area. The thermal maturity of an organic source rock is a key variable for oil and gas generation. Heat conditions and length of time determine the quantity and type of oil and gas generated from the organic content of source rocks.
Of the total US Bakken area, about 75% of the thermally mature area and about 97% of the marginally mature area are located in North Dakota.
Not all the thermally mature and marginally mature land area is suitable for well development. Continental Resources employs a risk factor for the percentage of land area suitable for well development. The risk factors are: 100% of the thermally mature Middle Bakken area; 70% of thermally mature Three Forks area; 90% of the marginally mature Middle Bakken area; and 60% of marginally mature Three Forks area.4
Checking Continental's well counts
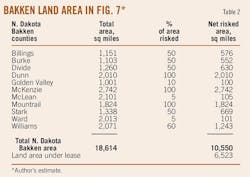
To check Continental Resources' land area estimate, the land area of the NDGS/NDMR mapping of Bakken oil and gas fields in Fig. 7 is estimated. The land area estimate is presented in Table 2 and is within 12% of the Continental Resources estimate.
Continental Resources states that complete well development of the North Dakota Bakken risked land area is four wells/sq mile: two wells/sq mile in the Middle Bakken formation and two wells/sq mile in the Three Forks formation.4
Based on the land area, well development assumptions, and risk factors, the number of wells for complete North Dakota Bakken well development is 38,980 wells. With an average EUR of 500,000 bbl/well, the quantity of recoverable oil is 19.5 billion bbl, 80% of Continental Resources' 24.3 billion bbl recoverable oil estimate for the entire US Bakken.
When Bakken output could peak
Attention is now turned to an evaluation of North Dakota Bakken oil production rates.
Because of the continuous declines in well production over time, new wells have to be brought into production to make up the production declines in order to maintain a constant oil production level.
Based on an average well production profile for wells with a 500,000-bbl EUR, the number of wells to sustain 1 million, 1.5 million, and 1 million b/d oil production rates for 30 years is 27,000 wells, 41,000 wells, and 55,000 wells, respectively. The question explored is the timing of when the land development area becomes saturated with well development.
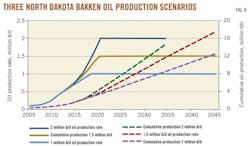
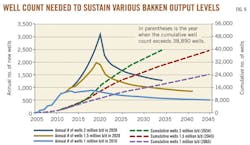
The carrying capacity of the North Dakota Bakken is established above at 38,980 wells. The three oil production scenarios are shown in Fig. 8. The corresponding well counts required for three oil production scenarios are presented in Fig. 9.
The graphs in Figs. 8 and 9 terminate on the year when well saturation of the well development area occurs. The year when well saturation occurs is provided in parenthesis on the cumulative labels in Fig. 9.
For a 2 million b/d oil production rate, well saturation occurs in 2034. For a 1.5 million b/d oil production rate, well saturation occurs in 2045. For a 1 million b/d oil production rate, well saturation occurs in 2065. Policymakers will have to decide which is best for the US economy.
The large scale-up in annual well completions to initiate the 1.5 million and 2 million b/d oil production rates in 2020 and the following large drop-off in annual well completions, as shown in Fig. 9, may prove problematic in terms of the efficient allocation of drilling and labor resources.
An alternative is to maintain the current pace of well development, which to a degree levels the annual number of well completions. With well development at the 2010-11 pace, a 1.5 million b/d oil production rate is realized in 2023, and a 2.0 million b/d rate is realized in 2029. The slower well development pace extends the timing of well saturation.
The viabilities of the well development estimates are consistent with those developed by the North Dakota Department of Mineral Resources (DMR). North Dakota DMR studies indicate that North Dakota has the potential to drill about 38,000 wells in the Bakken formation with infill wells and separate wells in the Middle Bakken and Three Forks strata.7 Also, the North Dakota DMR notes that long-term well production rates and EURs will be enhanced with future technological developments such as well refracs.
These findings indicate that the North Dakota portion of the Bakken formation will prove to be the largest oil field in the US. To date, Alaska's Prudhoe Bay is the largest US oil field and has produced about 13 billion bbl in its first 30 years of production. Prudhoe Bay sustained a 1.5 million b/d oil production rate for 9 years from 1980 to 1988 before going into decline. The findings of this study indicate that the North Dakota Bakken may be able to sustain a 1.5 million b/d oil production rate for about 25 years.
To address concerns that the above findings are based on too optimistic assumptions, a sensitivity analysis is performed to evaluate the effect of reductions in the average well production profile and the well development area on the timing of well saturation.
The two changes modeled are: 1) a 25% reduction in the average well production rate from an average well EUR of 500,000 bbl to an average well EUR of 375,000 bbl; and 2) a 10% reduction in the well development area, which reduces the total number of wells from 38,980 to 35,081 wells.
With a 25% reduction in the average well production rate, the cumulative number of wells to sustain 1 million, 1.5 million, and 1 million b/d oil production rates for 30 years are 36,525 wells, 54,788 wells, and 73,051 wells, respectively.
With a combined 10% reduction in well development area and a 25% reduction in the average well production profile, the year of well saturation for the 2 million b/d oil production rate moves forward 9 years to 2025 and for the 1.5 million b/d oil production rate the year of well saturation moves forward 14 years to 2031.
In the case of a reduced well production rate and well development area, the 1.5 million b/d oil production profile of the North Dakota Bakken closely resembles that of Prudhoe Bay.
The significance of well saturation is the effect on average well production rates. When well saturation occurs, new well drainage areas and new well production rates decrease. This in turn creates an increase in the number of additional wells required to maintain a given production level. At some point, the treadmill created by monthly well production declines is moving too fast for the economics of new well development to keep pace and field production begins to decline.
When production declines
When North Dakota Bakken oil production goes into decline, an interesting question is the rate of decline.
For continuous shale oil fields such as the North Dakota Bakken, the decline rate may not be as steep as those experienced in conventional reservoir oil fields. Upon well saturation of the development area with four wells/sq mile, E&P companies will continue to perform well refracs and drill infill wells as long as well economics are positive.
The timing of well saturation and the corresponding trajectory of oil production decline for the North Dakota Bakken is speculative until more is learned about the financial and production parameters of well refracs and infill wells.
In conclusion, the findings suggest that the North Dakota Bakken has the potential to realize an oil production rate of 1.5 million b/d even if the average well production rate is reduced by 25% and the well development area is reduced by 10%. A 2 million b/d oil production rate may be achievable if the well development area is 12,000 sq miles and the average EUR of 500,000 bbl/well holds for the total well development area.
The North Dakota Bakken will very likely surpass Prudhoe Bay as the nation's largest oil field. This is a major development for US oil production since as recently as 2008 the US Geological Survey placed the Bakken's technically recoverable oil resource base at about 4 billion bbl.1
Since the release of the 2008 USGS Bakken study, the oil production performance of the North Dakota Bakken has seriously called into question the accuracy of the USGS technically recoverable oil resource estimate. In response, Congress has called upon the USGS to reassess the Bakken's technically recoverable oil resources, and the USGS will begin a new 2 year Bakken study in 2012.
References
1. US Geological Survey, "2008 U.S. Geological Survey petroleum resource assessment of the Bakken Formation, Williston Basin Province, Montana and North Dakota," slide presentation prepared by the USGS, US Department of Interior, Washington, D.C., April 2008.
2. LeFever, Julie, and Helms, Lynn, "Bakken Formation Reserve Estimates," report prepared by the North Dakota Department of Mineral Resources, Bismarck, ND, 2010.
3. Nordeng, Stephan H., "The Bakken petroleum system: an example of a continuous petroleum accumulation," North Dakota Geological Survey, DMR Newsletter, Vol. 36, No. 1, 2009, pp. 21-24.
4. Continental Resources Inc., "Bakken field recoverable reserves," assessment prepared by Continental Resources Inc., Enid, Okla., Feb. 14, 2011.
5. Oil & Gas Journal, "Continental: Bakken's giant scope underappreciated," OGJ Online, Feb. 16, 2011.
6. Nordeng, Stephan, "First 60-90 Day Average Bakken Pool Production by Well," data compiled and presented by the North Dakota Geological Survey, North Dakota Department of Mineral Resources, Bismarck, ND, 2011.
7. Personal communications with Stephan Nordeng, a staff geologist with the North Dakota Geological Survey and Department of Mineral Resources, in September 2011 and February 2012.
The author
More Oil & Gas Journal Current Issue Articles
More Oil & Gas Journal Archives Issue Articles
View Oil and Gas Articles on PennEnergy.com
