Study improves control of slack line flow
Chen Yuanyuan
Gong Jing
Li Xiaoping
Zhou Tong
Zheng Lijun
China University of Petroleum
Beijing
New research has improved control of slack line flow in steep slope liquids pipelines, whether during commissioning, steady operations, or in the wake of an accident. Factors such as pipeline terrain, wall thickness, diameter, and terminus control pressure influence slack line flow. Increasing WT, decreasing ID, and increasing pressure all play into proper slack line control
Slack line flow is likely to emerge as soon as the line pressure of a liquids pipeline in hilly topography with steep slopes drops below saturated vapor pressure. Slack flow theory and computational analysis methods exist. Mainstream multiphase software, however, falls short of predicting slack position, length, vapor volume, holdup, and liquid velocity quickly and accurately.
Background
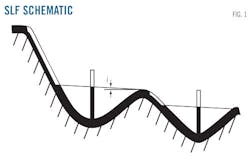
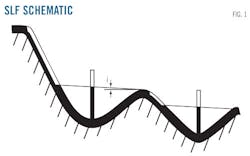
Slack line flow (SLF) behavior often develops in liquid pipelines (Fig. 1). This flow condition emerges at points or sections where the pipeline pressure drops below the vapor pressure of the liquid. It is common in pipelines which transport liquid, especially those crossing complex terrains with significant elevation changes.
From a thermodynamic perspective, when pipeline pressure falls below vapor pressure, a vapor bubble forms and the system reaches a balanced state. From a mechanical point of view, slack flow is similar to open channel flow. The flowing fluid in an open channel flow is not completely enclosed by solid boundaries and therefore has a free surface whose pressure remains constant at atmospheric pressure, or vapor pressure in the case of a pipeline.
Gas-liquid two-phase flow develops in pipe sections caught in the slack condition. The propagation of pressure waves in two-phase pipe flow is different from that in single-phase pipe flow, with the wave spread inhibited to some extent. This situation makes it difficult to accurately detect and then locate a leak. Slack flow condition may also cause upstream and downstream liquid columns to meet at high speed when the vapor bubble collapses, resulting in a probable huge overpressure of the pipeline.
These potential complications place a premium on determining slack position, length, and other flow parameters when pipeline is laid in mountain areas so that appropriate control measures can be adopted to ensure safe operation. The model established in this paper allows calculation of slack flow property parameters, including the slack position, length, vapor volume, holdup, and liquid velocity when the pipeline reaches a steady state, providing not only a reference during pipeline design, but support during operation as well.
Calculation
The following parameters should guide establishing the hydraulic model for SLF:
• Temperature drop in the vaporization process is ignored.
• Frictional loss between the two phases is ignored.
• Changes in oil density in the vaporization process are assumed to be negligible.
Varying transmission rates may create a turnover point in rough-terrain pipelines, creating SLF in the downward-inclined segment after the high point.
The steady hydraulic state consists of three cases: the tight-line segment before SLF, with flows dependent on pump energy; the slack-line region where hydrodynamic pressure is equal to saturated vapor pressure; and the full area flowing downstream relying on potential energy. Finding the turnover point allows the slack position and length to be calculated according to both hydraulic grade and pipeline profile.
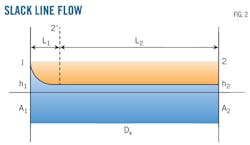
Two flow forms occur in the slack range: acceleration and uniform flow (Fig. 2).
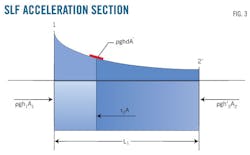
The acceleration section serves as the control volume (Fig. 3).
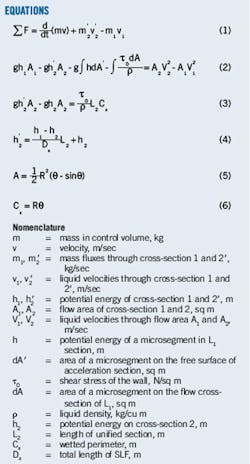
Equation 1 in the accompanying box shows the rate of total momentum change on the acceleration segment as equal to the total forces acting on the liquid surrounded by the boundaries. Applying force balance and the stable continuity equation to the acceleration section in Fig. 3 results in Equation 2. Equation 3 supplies the force balance equation on the uniform flow segment. Equation 4 shows the relationship between elevation and distance of the computed section.
SLF is similar to stratified flow. Assuming R is the pipeline ID and the central angle corresponding to the liquid phase is θ, the flow area, A, allows calculation of wetted perimeter, Cx, by Equations 5 and 6. Solving Equations 1-6 simultaneously, incorporating iterative calculations in a computer, yields the node parameters of slack holdup and liquid velocity.
Analysis
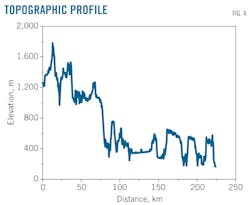
A proposed oil pipeline without a pressure reducing station (PRS) provides the setting for simulation and analysis. Fig. 4 shows the topographic profile, with the highest elevation 1,780 m at the distance of 12.93 km and lowest 167.78 m at the terminus. The elevation change of roughly 1,600 m is typical of a large-slope pipeline. The start and end points are the initial pump station and terminal station, respectively.
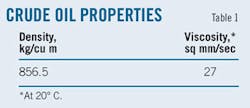
Table 1 outlines the properties of the transported oil. Researchers simulated and analyzed slack distribution and flow features. The main factors affecting SLF behavior are the liquid flow rate, pipe diameter, and the control pressure at which the pipeline reaches steady state.
Fig. 5 shows simulations under four different oil flow rates: 7-million tons/year, 8-million tpy, 9-million tpy, and 10-million tpy.
Characteristics of the slack conditions shown in Fig. 5 include:
• Extraordinary changes to the hydraulic properties of the pipeline. In all full-flow districts, the slope of the hydraulic grade line always stays constant. In slack line regions, however, the head is equal to the pipeline elevation and the head curve follows the elevation profile until the point at which slack line condition no longer exists.
• Larger frictional loss in slack areas than in tight line regions. After oil flows over the high point, the height difference can not only ensure the liquid flows to the end but that remaining potential leads to local velocity increases to consume this part of redundant energy, self-balancing the pipeline.
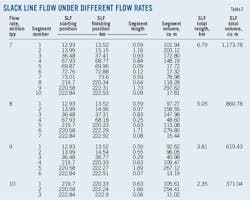
Table 2 lists the simulated slack position, length, and vapor volume under different conditions.
The ratios of slack length to the pipeline length in Table 2 are 3.02%, 2.25%, 1.69%, and 1.05%. The ratios of slack volume to the pipeline volume are 2.28%, 1.67%, 1.20%, and 0.72%, respectively, for four kinds of flow rate.
Slack length and volume decrease with increasing flow rate. With increasing oil flow the friction along the pipeline grows and the dynamic head and residual energy at each point decrease, resulting in the decreasing of slack length and volume. Efforts should therefore be made to avoid operating the pipeline at lower transmission rates.
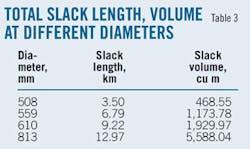
Fig. 6 shows SLF at different diameters: 508 mm, 559 mm, 610 mm, and 813 mm, with the slack distribution obviously sensitive to diameter variations. Table 3 presents length and volume parameters of different diameters.
When the diameter increased 60%, from 508 mm to 813 mm, slack length increased by about 270%, showing variations in diameter have a disproportionately large effect on slack flow distribution. Large-drop pipe sections should therefore use a smaller diameter or a corresponding increase in WT.
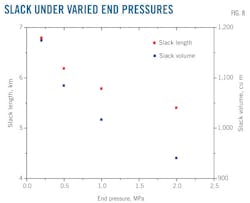
Figs. 7 and 8 show the simulated slack ranges under four different end-control pressures, 0.2 MPa, 0.5 MPa, 1.0 MPa, and 2.0 MPa, and the corresponding slack parameters, respectively.
A reduced trend on the slack regions appears with increases in the end control pressure. The amount of air in the oil pipeline is small, and the gas phase in the slack segment is consequently mainly oil vapor precipitated from the fluid. This precipitate reenters the liquid phase when pressure rises, resulting in reduced slack sections. For a pipeline operating with the flow rate and diameter basically identified, a gradual increase on pressure in the terminus can therefore be one of the effective methods to reduce or even eliminate slack flow conditions.
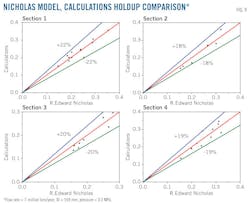
Slack flow is similar to open channel flow. R. Edward Nicholas derived an expression for forecasting the holdup and velocity in slack areas according to the Manning formula for open channel flow.1 Fig. 9 compares holdup calculated numerically by this article's model with that predicted by Nicholas.
The holdup in the slack regions will rapidly decrease as a result of vapor separating from the liquid and forming gas-liquid two-phase flow in the pipeline. The numerical simulation produces results reasonably close to Nicholas's, with the maximum discrepancy 22%.
Fig. 10 shows comparisons between this article's liquid velocity predictions and the Nicholas data. The maximum error is within 24%.
Velocity in slack sections is likely to increase to several times higher than that in full-flow regions. Excessive flow velocity may increase friction between the liquid phase and the pipe wall, potentially producing static electricity, and should attract particular attention from the operators.
Software simulation
The search for possible solution methods used black oil models in the mainstream multiphase flow software packages—PIPEPHASE, PIPEFLO, PIPESIM, and OLGA—to try to analyze slack behavior in large-slope pipeline. None of the currently available software, however, could accurately investigate slack performance at the state of steady flow. The physical model proposed in this article can cope with this issue and accordingly afford theoretical bases and technical support for both pipeline design and operation.
Control methods
Considering the potential harm that the slack condition may produce in the pipeline or equipment, appropriate control methods need to be taken to avoid slack line flow.
A unified hydraulic system forms when tight line flow is maintained. The majority of the pipeline design occurs in accordance with this scheme. Table 4 enumerates technological parameters and measures taken to guarantee full flow for several typical large-slope oil pipelines at home and abroad.2
Adjusting three design factors can typically affect full-flow pipeline operation: diameter, WT, and pressure reducing station performance.
Reducing the diameter of a pipeline at some point along its length could reduce the amount of steel needed and cut costs accordingly, but will make pigging and inspection difficult. Too large a reduction could also make addressing static-pressure surges in the pipeline's lower points more difficult. Increasing WT, on the other hand, can reduce both dynamic and hydrostatic pressure in normal operations and shutdown processes, improving pipeline safety but also increasing costs.
A pressure reducing station stands as the best method of slack control. Applying the throttling pressure drop produced in the pressure reducing valve to increase frictional head in the downward slope could both limit hydrodynamic pressure and prevent gasification in pipeline high points.
The pressure valve would turn closed immediately when the pipeline enters shutdown, cutting off static pressure to stop possible overpressure in low-lying parts and largely eliminating adverse effects of large terrain drops. Continuous development of automatic remote control technology also improves station design and operation management. Determining practical application of specific methods requires both technological and economic comparisons.
Slack control
Though typically problematic, slack line flow has some usable aspects, potentially decreasing dynamic pressure changes and eliminating the need for a pressure-reducing station. Removal of the pressure reducing valve positioned at a pipeline's terminus is also possible, making operation much easier. Kinder Morgan's Trans Mountain Pipeline in Canada is an example of one such system, running directly in a slack flow state.3
The spread of pressure wave will be suppressed and weakened because of the gas-liquid two-phase flow in the pipeline, extending the time over which pressure transforms, suppressing and weakening the pressure wave, and helping regulate any potential water hammer in the terminus. The length of the hydraulic system from origin to high point, however, will increase, extending the time required for the terminus to respond to flow adjustments executed at the initial station.
Accidents
An accident upstream in a pipeline—such as a valve suddenly closing or an unexpected shutdown of a pump unit—will lead to a decompression wave spreading downstream and a corresponding decrease in the liquid flow rate while the fluid ahead flows forward steadily until the decompression wave arrives. Liquid pressure will drop as a result of the velocity difference before and after the wave peak. If the liquid pressure falls below the saturated vapor pressure near the high point where lower hydrodynamic pressure develops, the separated bubble may fill the entire pipe space, leading to instantly stopped flow.4
Manuscripts welcomeOil & Gas Journal welcomes for publication consideration manuscripts about exploration and development, drilling, production, pipelines, LNG, and processing (refining, petrochemicals, and gas processing). These may be highly technical in nature and appeal or they may be more analytical by way of examining oil and natural gas supply, demand, and markets. OGJ accepts exclusive articles as well as manuscripts adapted from oral and poster presentations. An Author Guide is available at www.ogj.com, click "home" then "Submit an article." Or, contact the Chief Technology Editor ([email protected]; 713/963-6230; or, fax 713/963-6282), Oil & Gas Journal, 1455 West Loop South, Suite 400, Houston TX 77027 USA. |
Adjusting residual downstream pressure after the peak to avoid liquid column separation is one example of an active control procedure. Applying the inlet regulating valve in the terminating oil depot could, for example, keep peak pressure above vapor pressure in instances where the last intermediate station was also the high point.
An air valve can also be brought into the control system to prevent negative pressure during the transient process. The air valve position lies near the pipeline's high point where dynamic pressure is low throughout normal operations and liquid column separation may be likely transient course.
When the water hammer causes a vacuum to develop above the liquid phase, the air valve opens suddenly and pulls air into the pipe to avoid increasing negative pressure on the pipeline. Air pulled in will be expelled when pipeline pressure rises above the atmospheric pressure to avert formation of an air pocket in the pipeline. The valve can automatically shut as soon as the pipeline is once again liquid-filled to prevent outflow of the liquid.
Commissioning
Slack formation during commissioning differs from that experienced during operation. Liquid introduced to the pipeline pushes stagnant air down line with slack line flow likely to begin in the downhill slope (OGJ, Oct. 22, 2007, p. 70), requiring attention to the air instead of the liquid vapor.
Clearing the line of air prior to line fill will keep the pipeline from entering slack status while commissioning. The air release valve installed at the pipeline's high point or back-pressure control along the pipeline typically discharges the entrapped air pocket.
Control in regular pipeline operations correlates to commissioning.
References
1. Nicholas, R.E., "Simulation of Slack Line Flow: A Tutorial." Pipeline Simulation Interest Group, Albuquerque, NM, Oct. 19-20, 1995.
2. Liang, X.Z., and Tang, Z.Y., "The Famous Pipeline Projects in the World," Petroleum Industry Press, Beijing, 2002 (Chinese only).
3. Zhang, Q., and Gong, J., "Research on Process Control Technology to the End Section of West Products Pipeline," Oil & Gas Storage and Transportation, Vol. 27, No. 1, pp. 1-4, January 2008 (Chinese only).
4. Zhang, G.Z., "Pipeline Transient Flow Analysis," China University of Petroleum Press, Beijing, 2008 (Chinese only).
The authors
Chen Yuanyuan ([email protected]) is a PhD student at National Engineering Laboratory for Pipeline Safety, China University of Petroleum-Beijing.
Gong Jing ([email protected]) is a professor at China University of Petroleum-Beijing. She also serves as deputy dean of the College of Mechanical and Transportation Engineering at the university. She holds a PhD (1995) from China University of Petroleum-Beijing.
Li Xiaoping ([email protected]) is an associate professor at China University of Petroleum-Beijing. He holds a PhD (2005) from China University of Petroleum-Beijing. He is a member of Chinese Petroleum Society.
Zhou Tong ([email protected]) is a graduate student at National Engineering Laboratory for Pipeline Safety, China University of Petroleum-Beijing.
Zheng Lijun ([email protected]) is a graduate student at National Engineering Laboratory for Pipeline Safety, China University of Petroleum-Beijing.
