PIPELINE INTEGRITY—1: Accurate corrosion modeling improves reliability estimations
Francisco Caleyo
Alma Valor
Victoria Venegas
Jose Hiram Espina Hernandez
Julio C. Velazquez
Jose Manuel Hallen
ESIQIE, Instituto Politecnico Nacional
Mexico City
Researchers derived five corrosion rate distributions from different pit growth models and used them to perform reliability analyses of underground pipelines from synthetic and real-life data. Comparing the results of these analyses showed that considering the age, depth, and time-evolution of corrosion pits is critical to corrosion rate modeling and reliability estimations.
This first of two articles establishes the methodology for developing these models and examines each. The second, concluding article, compares the models' performance.
Background
Structural reliability analysis has become a key tool for assessment and mitigation of threats posed by corrosion in upstream, downstream, and transmission pipelines around the world (OGJ, Jan. 6, 2003, p. 54; OGJ, Jan. 13, 2003, p. 56).1-3 Probabilistic approaches allow assessment of the reliability of corroding pipelines. Such approaches should account for uncertainties associated with measuring corrosion-caused metal losses (defects), the pipe manufacturing process, and operating conditions.
The probabilistic distribution of defect corrosion growth rate, or simply corrosion rate (CR), must be estimated to predict future dimensions of corrosion defects.1 2 4 Prediction also requires a failure model, fed with the gathered and foreseen corrosion data, to calculate the pipeline's probability of failure by leakage or rupture4 within a given service life. The resulting reliability estimations allow decision-making regarding the timing and extent of future repairs and re-inspection frequency (OGJ, Jan. 6, 2003, p. 54; OGJ, Jan. 13, 2003, p. 56).
In developing methods to assess the reliability of corroding pipelines, researchers have put much effort into correctly addressing factors such as uncertainties inherent in determining defect dimensions (measurement errors) and the suitability of the failure model used to carry out the estimations (OGJ, Sept. 13, 2004, p. 76).1 2 By contrast, they have given less attention to developing sound models for estimating the probabilistic distribution of corrosion rate, which determines the time evolution of pipeline reliability.
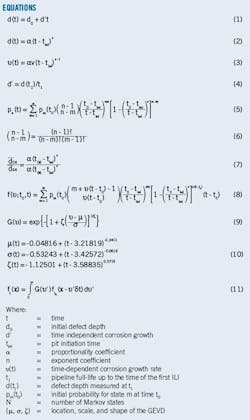
Many of the published works addressing pipeline reliability use a simple linear defect-growth model: a constant growth rate to estimate corrosion rate distribution.1-3 The linear growth model holds the depth of a corrosion defect over time as behaving as a linear function (Equation 1; OGJ, Jan. 6, 2003, p. 54; OGJ, Jan. 13, 2003, p. 56).
Data collected from an in-line inspection (ILI) allow estimating the corrosion rate distribution by calculating from Equation 1 for each defect depth, d, in the ILI report and assuming t to be the time interval during which the corrosion occurs. Other sources, such as the moment of third-party interference or coating detachment, also allow estimation of this interval. The lack of such data requires d0 be taken as zero and the assumption that corrosion defects have been growing for some proportion of the pipeline life, such as its full- or half-life.4
Two sets of ILI data gathered from the same pipeline can also allow assessment of corrosion rate distribution. Calculating the corrosion rate individually for each defect puts d0 and d as the defect depth at the time of the first and second inspections, respectively, into Equation 1, assuming t as the interval between the two inspections. The availability of two correlated ILI data sets, however, is rather infrequent due to changes in technology, odometer-related errors, and measurement errors (OGJ, Sept. 13, 2004, p. 76).
CR distribution used in reliability estimations of underground pipelines often is based on the operator's knowledge of soil. In the absence of pit-growth data, the National Association of Corrosion Engineers (NACE) recommends using a rate of 16 mils/year (0.4 mm/year).4 5
Some authors have also proposed the use of time-independent Weibull or normal distributions to describe CR.6 Such techniques use the same distribution for each of the defects in the defect population at each of the time points used to estimate pipeline reliability over a given period.
Wide acceptance exists, however, for the idea that time dependence of the depth of a corrosion defect follows a power function (Equation 2; OGJ, July 20, 2009, p. 64; OGJ, July 27, 2009, p. 56). Corrosion rate for this type of defect is also therefore time-dependent and has the form of Equation 3. Taking into account the power-type time dependence of defect growth when modeling the corrosion process should lead to a different corrosion rate distribution than obtained with the linear growth model.
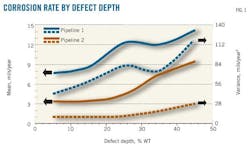
Other well-known characteristics of pitting corrosion rate, in addition to time dependence, include dependence on the defect depth and a marked stochastic character.7 Fig. 1 shows how the mean and variance of the corrosion rate depend on defect depth in two operating underground pipelines with two successive ILIs, with results shown in Fig. 2.
Researchers grouped the located and sized corrosion depths into 10%-WT-wide depth intervals, estimating the mean and variance of the CR distribution in each depth interval for defects with depths falling within the interval. Dividing the difference in depth from the first ILI to the second by the time elapsed between the two inspections, as required by Equation 1, allowed estimation of each defect's growth rate.
The CR mean and variance in the first pipeline (Pipeline 1) are greater than those of the second pipeline (Pipeline 2) because the corrosion defects in the former are newer and shallower. Both the mean and variance of the observed by-depth-interval CR values also increase with defect depth. These two facts, previously noted via experimental evidence (OGJ, July 20, 2009, p. 64; OGJ, July 27, 2009, p. 56),7 are critical to supporting the hypothesis of this article that a CR model should consider both age and depth of corrosion defects to be evolved in time, together with the actual shape of the function describing the observed dependence of the corrosion defect depth on time.
This article aims to elucidate which available defect growth model best predicts pit-depth evolution with time in underground pipelines, thereby helping determine the best CR distribution for the subsequent reliability estimations. The models under assessment consist of previously published and in-use-by-the-industry approaches aimed at predicting future pit-depth distribution beginning from an experimental data set gathered by ILI. Comparing future pit-depth distributions with a second ILI-measured pit-depth distribution in the same pipeline allows assessment of the accuracy of each model's estimations.
The applied corrosion rate distributions include a single-value CR based on NACE recommendations for buried pipelines,8 a distribution derived from the linear growth model, time-dependent and time-independent distributions predicted from a soil corrosion model developed by the authors in a previous work taking soil and pipe properties into consideration, and a distribution derived from a Markov chain corrosion model also developed by the authors (OGJ, July 20, 2009, p. 64; OGJ, July 27, 2009, p. 56).7
Researchers predicted pit-depth distributions for several future times using the CR models under assessment. Using the initial (measured or synthetic) and future (estimated) pit depths within a Monte Carlo framework allows calculation of both pipeline failure (rupture) pressure and annual pipeline failure probability and failure index over several years. Results illustrate the importance of choosing an appropriate corrosion rate distribution in conducting an accurate reliability analysis of a pipeline affected by pitting corrosion.
Methodology
The study underlying this article involved processing and analyzing both synthetic and ILI-measured corrosion data to establish the most appropriate corrosion-growth describing the time evolution of pitting corrosion depth distribution in buried pipelines. It also compared the performance of those models when included in the reliability analysis of modeled and inspected pipelines.
Experimental data used came from two successive magnetic flux leakage (MFL) ILIs—one in 1996 and the other in 2006—of an 18-in. OD, 28-km (17-mile) operating natural gas pipeline in southern Mexico. The pipeline, commissioned in 1985, is coal-tar coated, made of API 5L X52 steel, and has a 0.344-in. WT.
Matching the corrosion defects from both inspections under the constraint that, in addition to having the same location, their depths in the second inspection must be equal to or larger than that of the first inspection, preceded use of the ILI data. The matching process considered typical odometer and depth measurement errors of the MFL-ILI tools. Only the matched defects were part of the analyses that followed, ensuring that only actual defect progression with time was considered without including defects that might have occurred in the interval between the two inspections.
ILI data are named "1996-ILI" and "2006-ILI," referring to the matched defect populations measured in 1996 and in 2006, respectively.
Depth distribution of the defects in 1996-ILI were fed into each one of the CR growth models under assessment as the initial depth distribution. Comparing this distribution to that of defects observed in 2006-ILI best describes the observed pit-depth evolution over the 10-year interval between the two. Data from both inspections based on the observed change in depth of the matched defects over the interval, δt, helped determine an empirical CR distribution, which was then compared with the corrosion rate distributions predicted by the CR models under assessment.
Distributions for defect depth and length, OD and WT, and ultimate tensile strength of the 1996-ILI also fed into the reliability analysis framework covered in the sections that follow.
Corrosion rate models
Five CR models helped evolve the initial empirical pit-depth distribution of the defects in the 1996-ILI set. The analysis interval or evolution time was 10 years. Corrosion growth modeling design excluded evolution of the corrosion defect lengths. Changes in the defect length have little or no influence on the estimation of the failure probability associated with individual corrosion defects.1
Assessed corrosion rate models, outlined in the next section, include the linear growth model; Markov model; time-independent generalized extreme value distribution (TI-GEVD) model; time-dependent generalized extreme value distribution (TD-GEVD) model; and single corrosion-rate value model (SVCR), following NACE's recommendation.
• Linear growth model. This model assumes the depth of each corrosion defect evolves through time according to Equation 1, so that the corrosion rate, d', of the defect is calculated with Equation 4. The defects included in the 1996-ILI data use a t1 set to 11 years and a depth at the beginning of the pipeline operation assumed to be zero.
Equation 1 calculates the depth of each defect by the second inspection. In this case, d0 is the matched depth in 1996-ILI, Equation 4 gives defect corrosion rate d', and t is the time elapsed between the two inspections. Equation 1 must therefore substitute t with δt = 10 years.
The growth rate associated with each defect in the linear growth model is constant within the time interval under analysis and is determined by the defect depth at the time of the first inspection. This analysis, therefore, accounts for the depth and age of the defects but not their nonlinear nature. This oversimplification may lead to conservative reliability estimates if the service time of the pipeline is relatively long.7
Quite unrealistically, the CR distributions resulting from this model follow a normal distribution with a mean equal to the estimated (Equation 4) defect growth rate for the mean value of the observed pit-depth distribution. The random measurement errors of the ILI tool give the standard deviation of the CR distribution. A normal CR distribution, which varies from one defect to another only in its mean value, consequently affects each defect during reliability estimations. This is another limitation of the linear growth model, given that the stochastic nature of corrosion manifests differently with the age and dimension of resulting metal losses (Figs. 1 and 2).7
• Markov model. The Markov model used in this article uses a continuous-time, nonhomogenous linear growth, or pure-birth, Markov process capable of modeling external pitting corrosion in underground pipelines (OGJ, July 20, 2009, p. 64; OGJ, July 27, 2009, p. 56). It allows prediction of pitting corrosion depth evolution and rate distributions from the observed properties of the soil and the pipeline coating type.
Applying this Markov model requires only that the initial pit-depth distribution and a soil-pipe-dependent parameter be known; the exponent ν in Equation 2 as determined for the specific soil type (OGJ, July 20, 2009, p. 64). The value of ν varies for different soil textural classes and depends on properties such as pipe-to-soil potential, soil water content, bulk density of the soil, and pipeline coating type.7
The initial and final pit-depth distributions from the 1996-ILI and 2006-ILI inspections provided the basis for estimating the exponent ν instead of using the value previously recommended by the authors. Researchers divided WT into N equally spaced 0.1-mm wide Markov states. Converting the observed defect depth to Markov-state units preceded determination of the depth distribution in terms of probability Pm(t0) for the depth in a state equal to or less than m at time t0. Equations 5 and 6 determine the probability of a defect being in state n (n ≥ m) at time t = t0 + δt (OGJ, July 20, 2009, p. 64; OGJ, July 27, 2009, p. 56).7
In Equation 5, tini and ν describe the nonlinear time evolution of the corrosion depth in a buried pipeline according to Equation 2, while t0 corresponds to the time at which Pm(t0) was observed, or the time of initial inspection.
The incubation time of the corrosion metal losses in the pipeline is 28 years, the average pitting initiation time, tini, found by the authors for a generic soil class (OGJ, July 27, 2009, p. 56). Equation 7 calculated the exponent parameter of ν for the specific type of soil in which the pipe under analysis was buried by using the ratio between the pit-depth means ‹d96› and ‹d06›, measured by ILI in 1996 and 2006, respectively. Taking tini = 2.8 years, t06 = 21 years (from 1981 to 2006), and t96 = 11 years (from 1985 to 1996) allowed computing the exponent parameter, ν.
Equation 5 predicted the probability density function for the corrosion defect depth population at the time of the second inspection (2006) and then compared it with the observed distribution. Equation 8 calculated the CR distribution at time, t.
The properties of the CR distribution described by Equation 8 are well known (OGJ, July 20, 2009, p. 64; OGJ, July 27, 2009, p. 56).7 The features critical to this study are that the distribution itself depends on both the size and age of the corrosion defects and that such a dependence closely reflects the nonlinear nature of the corrosion process in buried pipelines.
In contrast with the rest of the models under consideration, not only the mean but also the shape and variance of the CR distribution derived through the Markov model depend on the defect ages and sizes. This dependence, and the fact that the actual soil and pipe properties determine the value of the model parameters, makes this model more realistic than the rest of the models.
• Time-dependent GEVD model (TD-GEVD). This model uses the time-varying corrosion rate distribution7 for a generic textural soil. The GEVD function (Equation 9) can describe the corrosion pit growth rate distribution for buried pipelines. The parameters in this function vary with time when describing the actual pit growth rate distributions in buried pipelines.7
The accompanying table lists these parameters (which can be fitted with the power functions given in Equation 10) with the location (μ) and scale (σ) parameters given in 0.1-mm units or Markov states. Using the convolution integral as defined by Equation 11, where G(υ) is taken as the CR distribution at the middle point of the time interval (δt/2), allows calculation of the probability density function of the future pit-depth distribution ft(χ) at time t from the time-dependent GEVD corrosion rate distribution (Equation 9) and the initial depth distribution ft0(χ) at t0. This estimation of pit-depth distribution allows comparison to both experimentally observed corrosion data and the results of the rest of the models considered in this article.
• Time-independent GEVD model (TI-GEVD). This model is similar to TD-GEVD except for the assumption that the parameters of the GEV corrosion rate distribution (Equation 9) are constant and equal to the parameters at the time, t0, of initial inspection. In the real-life case presented, first inspection occurred after 11 years of operation, setting t0 to 11 years.
As in TD-GEVD, Equation 11 can predict defect depth distribution, ft(χ), at a future moment of time, t, and then compare it with the experimental distribution and the results from the rest of the examined models.
• Single-value CR model (SVCR). This model uses the constant corrosion growth rate recommended by NACE (16 mils/year, 0.4 mm/year) as an average growth to track evolution of pit-depth over the analyzed period. Although very conservative, this rate can substitute for the absence of information about the actual defect growth rate in underground pipelines.4 Using Equation 1 with d' = 0.4 mm/year for each one of the matched defects from the first inspection (d0) in this article's modeling yielded future pit-depths (d). This approach, therefore, represents a very special and limited case of the linear growth model in which the growth rate is independent of age and depth of the corrosion defects.
References
1. Caleyo, F., Gonzalez, J.L., and Hallen, J.M., "A Study on the Reliability Assessment Methodology for Pipelines with Active Corrosion Defects," International Journal of Pressure Vessels and Piping, Vol. 79, Issue 1, pp. 77-86, January 2002.
2. Stephens, M., and Nessim, M., "A Comprehensive Approach to Corrosion Management Based on Structural Reliability Methods," International Pipeline Conference, Calgary, Sept. 25-29, 2006.
3. Li, S.X., Yu, S.R., Zeng, H.L., Li, J.H., and Liang, R., "Predicting Corrosion Remaining Life of Underground Pipelines with a Mechanically-based Probabilistic Model," Journal of Petroleum Science and Engineering, Vol. 65, Issue 3-4, pp. 162-66, April 2009.
4. Race, J.M., Dawson, S.J., Stanley, L.M., and Kariyawasam, S., "Development of a Predictive Model for Pipeline External Corrosion Rates," Journal of Pipeline Engineering, Vol. 6, No. 1, pp. 15-29, January-March 2007.
5. Standard Recommended Practice RP 0169-92: "Control of external corrosion on underground or submerged metallic piping systems," NACE, Houston, 1992.
6. Sheikh, A.K., Boah, J.K., and Hansen, D.A., "Statistical Modeling of Pitting Corrosion and Pipeline Reliability," Corrosion, Vol. 46, No. 3, pp. 190-97, March 1990.
7. Caleyo, F., Velazquez, J.C., Valor, A., and Hallen, J.M., "Probability distribution of pitting corrosion depth and rate in underground pipelines: A Monte Carlo study," Corrosion Science, Vol. 51, Issue 9, pp. 1,925-34, September 2009.
The authors
Francisco Caleyo ([email protected]) is a professor at the Instituto Politecnico Nacional (IPN) and a researcher at IPN's Convenios de Investigacion y Desarrollo de Integridad Mecanica (CIDIM), which has service contracts with Pemex for pipeline integrity and risk analysis. He holds BS and MS degrees in physics from Universidad de La Habana, Cuba, and a PhD in materials science from Universidad Autonoma del Estado de Mexico, Toluca.
Alma Valor ([email protected]) is a researcher at CIDIM. She holds a BS and MS in physics from Lomonosov Moscow State University and a PhD in advanced technology from IPN.
Victoria Venegas ([email protected]) is a researcher at CIDIM. She holds a BS in chemistry from Universidad de la Habana and an MS and PhD in materials science from IPN.
Jose Hiram Espina Hernandez ([email protected]) is a professor at IPN and a researcher at CIDIM IPN. He holds a BS in electrical engineering, an MS in automation, and a PhD in technical sciences from the Instituto Superior Politecnico Jose Antonio Echeverria, Havana.
Julio C. Velazquez ([email protected]) is an associate professor at IPN and an integrity and risk analyst at Pemex. He holds a BS in chemistry and an MS and PhD in materials science from IPN.
Jose Manuel Hallen ([email protected]) is a professor at IPN and heads CIDIM. He holds a BS and MS in physical metallurgy from IPN, and a PhD in physical metallurgy from University of Montreal.


