Dwindling stocks set to overtake OPEC oversupply
At what point do shrinking inventories of oil and overproduction by the Organization of Petroleum Exporting Countries cease to cancel each other out?
The outlook for demand, pushed largely by the economy, dictates the former; OPEC's need to defend price will determine the latter.
In the most recent report at presstime by the American Petroleum Institute, crude oil stocks fell by almost 4 million bbl the first week in August and reached their lowest level since October 2001.
US stocks of crude and inventories have fallen by 22 million bbl since the end of March, noted Aaron Brady, senior analyst with Boston-based think tank Energy Security Analysis Inc. Inventories in the Petroleum Allocation for Defense District II have fallen to the levels seen in 2000 and 2001 that spawned oil prices above $30/bbl.
And while product stocks in the Organization for Economic Cooperation and Development countries rose at the end of the second quarter, the quarter's stockbuild was well below-500,000 b/d vs. 800,000 b/d-the average of the preceding 5 years for the period, according to the International Energy Agency.
Demand
It's still difficult to get a firm handle on what is happening with global oil demand. IEA estimates that OECD oil demand was weaker than expected in the first half, which pulled down projected global demand growth to a paltry 200,000 b/d for the year.
But the US Energy Information Administration sees a stronger economic recovery in the second half, hiking global oil demand by 500,000 b/d on the year.
The two agencies come closer to converging in their 2003 forecasts of oil demand growth at 1.1 million b/d and 1.2 million b/d, respectively.
Supply
Meantime, OPEC's increasing laxity on production restraint is bolstering the global supply picture-for the moment.
The organization drove an 800,000 b/d increase in world oil production in July, with the OPEC 10 (excluding Iraq) producing 1.5 million b/d above target.
But from EIA's standpoint, the earlier OPEC production cuts have contributed to an overall sharp decline in oil supply this year vs. last year of 1.1 million b/d. That means the stage is still set for a supply crunch in the second half, as EIA anticipates an 800,000 b/d draw on inventories.
"A look at the deficits in the crude oil balance suggests OPEC will need to raise production, despite an already substantial amount of overproduction relative to existing quotas," Brady said.
New evidence that the US economy has declined for 3 straight quarters and is still struggling to stay out of a double-dip recession has to weigh heavily on OPEC's collective minds at the Sept. 18 meeting in Osaka.
Accordingly, Brady contends that OPEC will likely raise its quotas at that meeting in response to an improving economy and growing oil demand, particularly in the US.
But if there are early signs that a demand recovery is not in the offing, then OPEC is likely to reverse course quickly to defend a $22-28/bbl price band that has served it well.
"OPEC will continue to suffer some short-term erosion in market share to non-OPEC producers in exchange for reasonably firm prices," Brady said.
$30/bbl again?
Will that dedication to price defense lay the foundation for still higher prices in 2003?
EIA seems to think so. In its latest short-term energy outlook, the agency predicts that the looming supply-demand squeeze will push West Texas Intermediate crude to nearly $30/bbl in early to mid-2003 and an average $30.06/bbl for the whole year, vs. an average of $26.04/bbl pegged for this year.
Of course, these prices are predicated on the normal projections of supply and demand and don't factor in a crisis. Looking at Iraq, Venezuela, and Israel-Palestine today, perhaps a normal projection should include a crisis factor. And perhaps a stillborn economic recovery next year as well.
OGJ Hotline Market Pulse
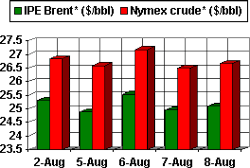
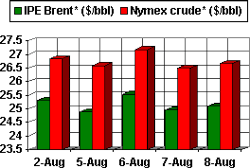
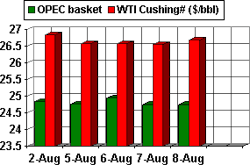
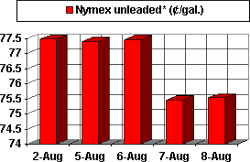
Latest Prices as of Aug. 9, 2002
null
null
Nymex unleaded
null
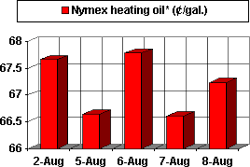
Nymex heating oil
null
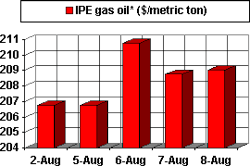
IPE gas oil
null
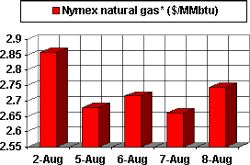
Nymex natural gas
null
NOTE: Because of holidays, lack of data availability, or rescheduling of chart publication, prices shown may not always reflect the immediate preceding 5 days.
*Futures price, next month delivery. #Spot price. @New contract
