Study verifies safe operating limits for batched line using DRAs
Pak-Arab Refinery Ltd. (PARCO), Karachi, Pakistan, achieved a 33% increase in capacity on a 16-in. OD multiproducts pipeline by using drag-reducing agents (DRAs) rather than more conventional methods.
The approach was chosen over installing new pumping capacity or looping the pipeline, both expensive capital-cost solutions.
Use of DRAs reduced the pumping pressures required while increasing flow.
The pipeline was designed to deliver 4.5 million tonnes/year (tpy) of batched product to the refinery at Mahmood Kot. It can now, however, safely transport a maximum of 4.5 million tpy of crude and 1.5 million tpy of diesel.
Outlined here is the analysis used to verify that the pipeline could be safely operated with increased flow rates. The process was complicated because the pipeline runs batched products in a telescoped pipeline with four pump stations.
Technical issues
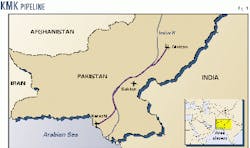
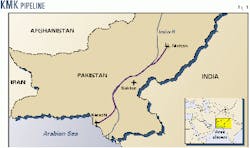
The 16-in. OD multiproducts pipeline (Fig. 1) is designed to transport batches of high-speed diesel, kerosine, light diesel oil, and crude oil from Korangi to Mahmood Kot (KMK). Since commissioning in 1981, however, only high-speed diesel and kerosine move through the pipeline.
It is 859 km long and split into four sections with four pump stations, each with four pumping units including one standby. In each section, the pipe wall thickness is telescoped to minimize line pipe costs as the maximum allowable operating pressure (MAOP) reduces over its length.
With the planned commissioning of the refinery at Mahmood Kot in September 2000, PARCO wanted to introduce the crude to the line by July 2000 and increase the flow rates even further.
Hence, the company wanted to determine what throughputs could be achieved without exceeding safe operating limits.
Subsequently, PARCO contracted Kvaerner to investigate the potential maximum safe throughputs for the pipeline, based on batched flows of three crudes and diesel.
Several technical issues needed to be addressed in the study.
Kvaerner's task was to develop a methodology for determining the safe operating limits of the pipeline. The challenges, none of which was unique in itself, in combination made for a difficult and interesting study.
Determining safe operating limits for an existing pipeline system presented a flow-modeling challenge.
Typically, when a new system is modeled during design, the models are conservative and tend to over-predict the pressure drops through pipeline sections. Modeling for increased capacity in an existing system, however, cannot adopt this approach.
The models must be matched to actual operating data over a range of flow rates to ensure that the model is accurately representing the real situation and provides a sound basis for any subsequent analyses.
The pipeline system had originally been designed to transport a number of products. Until now, PARCO had transmitted batches of kerosine and diesel in the pipeline.
The flow upgrade study was to consider batching crude and diesel flows only, with three types of crude being transported and the kerosine product discontinued.
Introducing batching to the flow modeling creates a number of possible operating cases, with different combinations of the products in the line and with the interfaces between the fluids at any possible location in the pipeline system.
Each of the four sections of the pipeline had telescoping wall thicknesses. This means the wall thickness of the section reduces in a number of step changes along its length.
This approach is adopted to minimize pipe material costs for construction and can be justified because the pipeline pressure reduces along the length. The overall effect is to reduce the MAOP of each segment.
The effect on modeling is that every step change of wall thickness must be checked for each model analysis to ensure that all MAOPs for all sections of pipeline are not exceeded during both normal operation or surge conditions.
The flow upgrade to the PARCO pipeline is achieved by injection of DRA to both the crude and diesel batches in varying amounts.
DRAs are designed to reduce the pressure required to drive a fluid through a pipeline. They are chemicals that can be added in small quantities to the fluid and reduce the viscous drag forces in the flow.
Typically, the amount of DRA added is sufficiently small to leave all other fluid properties (such as density) unaffected.
It was critical that a viable method of modeling the effect of the DRA on the fluid flow be used. This was equally true for the steady-state and transient analyses.
It was soon realized that either specialist models of DRA enhanced flow or adaptations of existing software would be required to meet these needs.
Methodology
The flow upgrade study was executed by carrying out both steady state and transient flow simulations for the pipeline system at the required elevated flow rates. The work undertaken consisted of three phases.
- Model the current operating conditions so that pipe roughness, temperatures, and other factors can be "tuned" to match the pressure losses measured from the field.
- Model the steady-state flows to determine the operating conditions and limits when DRA was being used.
- Perform a transient (surge) analysis to determine the effect of the increased flow rates on the likely surge pressures.
Data matching, validation
Before any hydraulic calculations were carried out, it was important accurately to match to a steady-state flow model the pressure losses generated in the pipeline under normal flows (without DRA).
This would allow the model to be "tuned" to match the physical situation and determine the correct parameters for wall roughness and heat loss. This tuning is important because there are several parameters that need to be considered and evaluated.
The data matching had to be performed mainly on the diesel flows because the kerosine transmission was to be discontinued and no operation data for the crude oils were available.
Subsequently, transient-flow models for the increased flow rates would be matched to the steady-state model results.
The known data consisted of nominal pipeline diameter, pipeline section lengths, elevation profiles, variations in wall thickness, and diesel liquid properties.
The operational data provided for each pipeline section consisted of pump station discharge pressure, pump station discharge temperature, and arrival pressure and temperature.
The model parameters that were altered to match the field data were pipeline internal roughness and overall heat-transfer coefficient.
The expected accuracy of the field data was determined to provide a benchmark for the modeled results.
All model results were tailored to be within this accuracy band but to over-predict the actual operating pressures. This would ensure conservative results from the model while still accurately representing the actual system.
Hydraulic analysis
Once the operational data provided by PARCO had been matched, the steady-state models for each of the pipeline sections were assumed to be a reasonable approximations to the physical system. These models were then used to produce the calculated operating conditions for all the proposed flow cases.
The choice of steady-state analysis software and the methodology for modeling the effect of DRA were considered. The PIPEFLO software package was used with some post-processing of results to take into account the effect of the DRA. This is outlined in more detail presently.
The cases to be studied were determined by considering the batching process and the possible operating conditions that can occur in the pipeline system.
The size of the crude batches was fixed at approximately 708 km of pipeline length. The batch size of diesel depends on the annual flow rate:
- 6.0 million tpy: 233 km length.
- 6.5 million tpy: 316 km length.
- 7.0 million tpy: 391 km length.
- 7.5 million tpy: 475 km length.
In all cases, the batch length is longer than the longest of the four pipeline sections. This proved an important factor in identifying the worst cases.
Checking the pressure losses in the pipeline against the pump head that can be achieved at that flow rate determined the required reduction in friction losses by DRA injection.
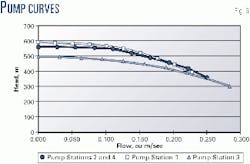
In order to do this, a complete set of pump curves was generated which were extrapolated to include operation at the increased flow rates.
Transient analysis
Any sudden interruptions to pipeline flow will lead to a significant pressure rise or fall as dynamic energy is converted to pressure energy. Such interruptions can arise from valve closures and pump trips.
The PARCO study modeled the following events:
- Emergency shutdown valve (ESD) closure at a pump station outlet.
- ESD valve closure at a pump station inlet.
- Block-valve closures.
- Effect on an upstream pump station of a pump trip.
The pressure margin for surge must also be checked at each of the points where the pipeline changes wall thickness. Also considered was the effect of pipeline packing due to the delay between valve closures and pump trips.
Networks were set up using the Flowmaster software that would enable the surge effects to be modeled. These networks included the pipeline, the three running pumps, and the required valves.
The pump models used in these networks matched the actual pump curves, and their power, inertia, and torque were calculated from guidelines suggested by Flowmaster for use in such analyses.
The pipeline section components were given the full elevation profiles that were adjusted accordingly when the network was used to model the action of a block valve part way along the pipeline section length.
Fig. 2 shows the network model.
The modeled valves were full-bore ball valves with the block valves closing in 10 sec. For most of the analyses, it was assumed that the closure rate of the valve is constant such that the flow is mostly closed off in the last few turns (due to the shape of the fluid path through the aperture). This is typically the worst case for surge pressure rises due to valve closures.
A modeled discrete loss in the system downstream of the pumps ("DL" on the network diagrams) is a component that gives a predetermined pressure loss that depends on the flow rate. It was used to model the effect of pressure losses after the pumps and the pressure loss across the control valve.
To analyze a case, it was first necessary to determine the correct steady-state conditions by matching the flows with the steady-state results, including the effects of the DRA. This was achieved by setting up the correct flow rate in the system and finding the modeled discharge pressure from the pumps.
The parameters of the discrete loss were then adjusted to give the correct entry pressure to the pipeline for the flow rate required. Then, by a process of trial and error, the required friction factor to the flow in the pipeline could be determined such that the arrival pressure at the end of the pipeline section under study was correct.
The number of cases arising from all the possible combinations of surge-pressure condition, pipeline section, flow rate, and fluid was large. A systematic approach identified critical cases for subsequent analysis.
This approach included the following key steps:
- An analysis determined which of the fluids would give the worst surge effects with the pipeline section full of that fluid.
- With that fluid alone, a second analysis determined which of the flow rates would give the worst surge effects.
Modeling DRA effects
There are no proprietary software packages (other than specialist routines held by DRA manufacturers) that directly model the viscous behavior of a fluid with DRA. Hence, it is the overall effect of the DRA rather than its actual behavior that must be modeled.
Possible alterations in a model to reduce the pressure drop to simulate the effect of DRA are the following:
- Reducing the viscosity of the fluid.
- Changing the pipe roughness.
- Changing the friction factor.
A brief investigation of these was carried out.
The most obvious way to simulate the reduction in viscous drag in the fluid would be to reduce the modeled fluid viscosity. It was determined, however, that even an extremely low viscosity value would not produce the required reduction in pressure drop.
This can be demonstrated by considering the effect of reducing viscosity on the pressure-drop calculations. These calculations are based on Reynolds number (Equation 1 in the accompanying equations box), a nondimensional characteristic of flow based on velocity and viscosity.
The Reynolds number is used to determine the friction factor for the flow. This friction factor (f) may be determined by a number of correlations including Colebrooke-White,1 Moody,2 and Chen.3
Both the Moody and Chen correlations are explicit and hence preferred in hydraulic analyses. The present study used the Chen correlation (Equation 2a) because of its higher accuracy.
For illustration, the Moody correlation is shown (Equation 2b) because it is better known and simpler.
It is clear that, as the viscosity tends to zero and Reynolds number to infinity, the friction factor tends to the value yielded by Equation 3.
For the maximum flow conditions modeled in the study, the calculated friction factor is 0.0052. From Equation 3, for the same physical data, the minimum friction factor that can be achieved is 0.0031.
The Darcy equation (Equation 4) relates the pressure loss directly to friction factor.
Hence, the percentage reduction in friction factor is directly proportional to the percentage reduction in pressure loss. Therefore, the maximum reduction in pressure drop that can be modeled by simply changing the fluid viscosity is approximately 40%.
Similarly, even a theoretically smooth pipe wall would not reduce the pressure drop sufficiently to match the effect of DRA. In this case, the roughness term tends to zero to give the value yielded from Equation 5.
The resulting friction factor would be 0.0049 for the same data, a pressure-loss reduction of only 6%.
Therefore, to match the effect of the DRA, the friction factor must be modified directly. The pressure drop over any given length of pipeline is directly proportional to the friction factor, which relates the overall fluid drag to the pipe roughness and the viscous forces in the fluid.
Since the drag-reduction effect from DRA is typically expressed in a percentage reduction in drag, this would be directly proportional to a percentage reduction in friction factor and in pressure drop along the pipe.
Proprietary flow modeling software packages seldom give the option to alter the friction factor calculations for the flow. Hence, the only way to carry out the modeling correctly was to model the flows without DRA and then carry out further analysis of the results to account for the effect of the DRA.
For each of the cases that define the batched-flow operating envelope, the steady-state models were run to determine the pressure profile under normal conditions (no DRA).
This profile is a combination of elevation head and dynamic (drag) pressure losses. The pressure profile data were exported from the modeling software to a spreadsheet.
It was then necessary to isolate the dynamic pressure-loss profile, which can then be scaled to account for the effect of varying amounts of dynamic pressure-loss reduction (drag reduction).
Matching existing system
Because an existing system was to be upgraded, it was important to tune the models to be used to match the actual operational data. This ensured that the results obtained would closely match the real situation and accounted for field factors that are typically not included in hydraulics modeling.
PARCO provided operating data on pressures and flow rates of operation that Kvaerner attempted to match with proprietary hydraulics-modeling software. This proved more difficult than was envisioned at the outset.
The initial field data for operation of the pipeline with diesel only proved difficult to match with the calculated pressure drops for the different pipeline sections.
The two internal pipe-roughness values considered typical steel pipe at 0.046 mm and very smooth pipe at 0.01 mm. Both of these gave higher pressure drops than observed in the field.
Because attempts to match the recorded data by tuning the pipe roughness failed (even with the smoothest steel pipe roughness of 0.01 mm), another possible variable was considered. A sensitivity analysis was carried out on the effect of viscosity changes.
The initial calculations were carried out with measured viscosity data for a typical high-speed diesel as initial data supplied provided only a single viscosity point (5.66 cp at 21 degrees C.).
The results of the sensitivity analysis showed that the fluid viscosity has a major effect on the pressure-drop calculations. A reduction in viscosity of approximately 0.2 cp at 20 degrees C. reduces the pressure drop in a pipeline section by more than 2 bar.
These results showed that it was critical to have the correct fluid-viscosity data for the model. As a result, revised viscosity measurements for the diesel were provided from laboratory tests conducted in April 1999. All the field data sets were reviewed with the revised viscosity data.
Finally, even with the revised viscosity data, it was not possible to match the measured pressure drops for the nominal pipeline diameter quoted. A very smooth pipe (0.01 mm roughness) still gave a pressure-drop prediction that exceeded the measured values.
Indeed, even modeling a completely smooth pipeline resulted in pressure drops in excess of the measured values.
The only variable remaining to be examined was pipeline diameter. It was found that by fixing the pipeline roughness at a typical value (0.046 mm) and assuming the maximum 0.75% increase in pipeline OD allowed in the API 5L standard, pressure drops in the range of the measured results could be achieved.
It was agreed with PARCO to adopt this approach to matching the steady-state cases. While not as satisfactory as a match with the correct viscosity and varying only the pipe roughness, this solution was both acceptable and conservative.
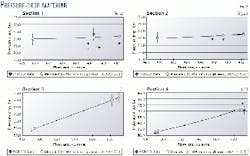
The correct viscosity was used, and the pipe roughness modeled is typical of a pipeline that has been in service for some time. Also, the modeled pressure drops in the pipeline sections are within the +5% accuracy required and tend to be higher than the field data pressure drops.
Fig. 3 shows the results for each section.
Worst operating cases
The batched nature of the proposed new flows, to be modeled in detail, would have required a vast number of cases to be studied to track all the possible combinations of flow rate, fluids in the line, and position of the interfaces.
A more practical approach had to be adopted that reduced the number of hydraulic cases studied to a manageable number.
The critical factor in reducing the number of flow-model simulations that would be required to define the steady-state operating envelope was that in all cases the batch length is longer than the longest of the four pipeline sections.
This meant that there would only be two fluids in a section of line (between pump stations) at any given moment. Hence, defining the complete operating envelope only required modeling the steady-state flows for each pipeline section at each flow rate with each line full of one of the four fluids (diesel and three crude oils).
Fig. 4 shows these cases.
The pressures and flow rates for those cases in which a fluid interface is somewhere in a section would fall within the envelope defined by the worst cases modeled.
Hence, if the hydraulic design for the system met all the worst cases identified, then the system would work for all other combinations of flow.
Consideration had to be given in calculations of the pumping capacity and the amount of drag reduction required to the cases in which there is a fluid in the pipeline that is different from that which is in the pumps at the pump station.
Therefore, combinations of all the fluids filling a section but with the interface having passed through the pumps such that they are working on a different fluid had to be studied.
This determined the full range of operation for the pipeline system.
This approach can only be taken when the batch lengths are longer than the pipeline sections between pump stations. This criterion was fulfilled in the study.
Pump curves
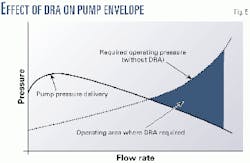
Determining the drag reduction required is not simply a question of comparing the operating pressure with and without DRA. The effect of the increased flow rates on the pumps must also be considered.
As the flow rate increases, the head developed by the pump reduces. Hence, the available operating pressure for the pipeline section reduces, which further increases the drag reduction required.
Fig. 5 shows this effect.
Hence, the required reduction in drag losses by DRA injection was determined by checking the pressure losses in the pipeline against the pump head that can be achieved at that flow rate.
The amount by which the required operating pressures at a given flow rate (without DRA) is greater than the head that can be developed by the pump determines the amount of DRA required.
Calculating this required generation of a complete set of pump curves (Fig. 6) that were extrapolated to include operation at the increased flow rates.
Also, it was considered that the pump head achievable at a given flow rate depends not only on the flow rate but also on which of the four fluids is present in the pump. The individual pump curves given allowed definition of the head vs. flow characteristics of the pumps. Then the maximum pressure rise through the pump for each of the four fluids was calculated.
It was now possible to determine the amount by which the dynamic pressure losses must be reduced with the DRA injection. This was done for each fluid, each pipeline section, and each flow rate. The constraints were the pipeline MAOP and the available pump-pressure rises.
Finally, the required drag reduction must be within achievable limits for all the possible combinations of fluid in the pipeline and fluid in the pumps.
Surge-study cases
As with steady-state analysis, it would not be practical to model every possible combination of fluid and operating flow rate.
A more practical approach adopted relied on identifying the worst cases for surge and modeling the surge-pressure events for them.
The following analyses identified that diesel flows at the lowest of the upgraded flow rates would provide the worst surge cases.
The case chosen for analysis of worst-case fluid was:
- Pipeline Section 1.
- 7.5 million tpy flow case.
- Closure of fourth block valve along the pipeline.
- Pumps tripped on high-pressure signal.
- Pump trip set at 100 barg.
It was clear from the results generated in this case that diesel in the line and in the pumps will give the worst-case surge pressures. This was expected because the diesel is the heaviest fluid and has the highest bulk modulus.
This means that the flow has more momentum than the other fluids at the same velocity and that the shock waves travel more quickly through the fluid.
It was also clear from the results of this case that it will not be possible to set the pumps to trip at the pipeline MAOP because this will cause an over-pressure in the line.
It is likely that the pump trip pressure will have to be set at slightly greater than the operating pressure for each flow rate.
The case chosen for the worst-case flow rate analysis was:
- Pipeline Section 1.
- Worst-case fluid (as defined previously) in the pipe and in the pumps.
- Closure of fourth block valve.
- Pumps tripped on high-pressure signal.
- Pump trip set at 4 bar greater than operating pressure.
It was clear from the results generated in this case that the greatest surge pressure will be generated by flows at 6.0 million tpy.
This result is unusual because it shows that the lowest of the modeled flow rates would give the highest pressure in the pipeline during surge conditions. Typically, because the surge pressure is directly related to the change of flow momentum, the highest pressures are generated at the highest flow rates.
It is the effect of the DRA that produces this result. The operating pressures for steady-state flows are much lower for high flow rates (with DRA injection allowing the increased flow rate).
Hence, although the surge pressure rise is higher, it is superimposed on the low operating pressure, and the net effect is lower pressures during surge at higher flow rates.
Study results
The study concluded that all the flow rates can be accommodated within the pipeline MAOP under steady-state conditions and that the worst case for surge conditions would be diesel flowing at 6 million tpy.
No additional equipment was considered necessary to ensure safe operation at increased flow rates. Control logic to trip a pump before a block valve is closed, however, was strongly recommended.
The steady-state analysis defined the operating conditions required to drive the batches of fluid through the pipeline sections while remaining within the pipeline MAOP.
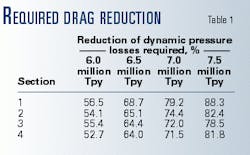
Table 1 shows the amount of drag reduction required. This is the percentage reduction in the dynamic pressure losses required. (Pressure variation due to elevation change is not affected by DRA.)
The most difficult flow conditions to meet occur when a heavy or high-viscosity fluid is in the pipeline and the lightest fluid is in the pumps. This is because the lightest fluid in the pumps gives the least pressure delivery.
It should be noted that the maximum drag reduction required is about 88% and verification of whether this is achievable was outside the study scope.
Preliminary discussions with a DRA supplier, however, indicated the maximum drag reduction is in the range of 75-80%. Higher drag-reduction values may be attainable after laboratory tests on crude and modification to pump sets.
Further, the amount of DRA required for reaching the drag reductions predicted was unknown.
It is now known that achieving a capacity of about 6 million tpy for batched flow of diesel and kerosine requires 325 gpd of DRA at present. That is 325 gpd for a 53-57% drag reduction.
The transient analysis showed that the worst cases for surge pressures occur with diesel flow at the lowest of the elevated flow rates (6 million tpy).
The analysis has shown that an ESD valve closure at a pump station (either suction or discharge) will not cause overpressure at any location in the pipeline. This is true for all pipeline sections.
Study of block-valve closures has shown that it is unacceptable to close a block valve unless the pumps upstream have first been tripped. This is a common operating mode and although this may not be a requirement for the designed flow rate (without injection of DRA), it is a good practice to adopt.
Shutting the pumps before (or even at the same time) as closing a block valve will avoid any over-pressure.
It was found that the tripping of the pumps caused no adverse pressure conditions and formed no vapor cavities in the system.
The study identified further areas of investigation before increased throughputs begin to be transported. These were:
- Setting of the pressure trip levels for the pumps.
- Consideration of rearranging the pump configuration to have them in parallel.
- Consultation with suppliers of the DRA to determine whether the flow improvement required can be achieved.
Implementation status
PARCO now safely operates the pipeline at a capacity of about 6 million tpy for batched flow of diesel and kerosine (the worst surge-condition case).
The logic control was modified experimentally for one block valve in order to stop the pumps before the valve is fully closed. The same logic will be adopted for the other valves in due course.
The pressure trip settings for the pumps have been reset in line with the study recommendations and the rearrangement of the pump configuration is currently under study.
The 6-million-tpy flows of diesel and kerosine have been found to require 325 gpd of DRA.
What was learned
The overall conclusions of the study were:
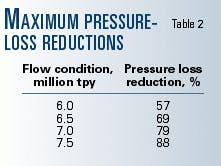
- All the steady-state flow rates can be accommodated within the existing pipeline MAOP. To achieve this, the maximum reductions in dynamic pressure loss shown in Table 2 are required.
- For surge conditions, the worst (highest) surge pressures are generated when running diesel at the 6 million tpy flow rate.
- When running at elevated flow rates with DRA, block valves in the pipeline should only be closed if the pumps have already been tripped off. This can be added to the logic circuits in the control room.
- Pump trips produce no adverse pressure conditions in the pipeline sections.
- For any of the elevated flow rates, the closure of any ESD valves will not result in surge pressures exceeding the safe limits.
- No additional equipment is required to operate safely at the desired flow rates. It was strongly recommended, however, that control logic be incorporated to ensure that the pumps are always tripped off before a block valve is closed.
In modeling of an existing pipeline system, it can be difficult to match the modeled data with the field data. In these cases, it is important to know the viscosity of the modeled fluids because the results are sensitive to this parameter. Also, it is useful to have an estimate of the accuracy of the field data to be matched.
Modeling DRA can be achieved by producing the pressure profile from the steady-state model and carrying out calculations to separate the static pressures from the dynamic pressures. The dynamic pressures can then be scaled, based on the amount of drag reduction.
In the study of batched flow, if any individual batch is longer than the pipeline section, then it is possible to reduce the number of simulations required to define the operating envelope.
This is because there will never be more than two fluids in each pipeline section and the extents of the operating range will be the flows with a single fluid in a section.
It is important to remember that the amount of DRA required increases significantly as the flow is increased because the pressure delivered by the pumps reduces.
The most difficult flow conditions to meet are when a heavy or high-viscosity fluid is in the pipeline and the lightest fluid is in the pumps because the lightest fluid in the pumps gives the least pressure delivery.
The worst-case surge analysis will not necessarily be the highest flow rate condition. This is because the actual operating pressure reduces as the flow rate is increased. (The available head from the pumps reduces with increasing flow rate.)
It is therefore important to define the worst surge cases before carrying out the full analysis.
Acknowledgments
The authors thank PARCO and Kvaerner management for permission to publish this article.
References
- Colebrook, C.F., Turbulent Flow in Pipes With Particular Reference to the Transition Region Between the Smooth and Rough Pipe Laws, Journal of Institute of Civil Engineering, Vol. 11. 1939.
- Moody, M.L., An Approximate Formula for Pipe Friction Factors, ASME, Vol. 69, 1947.
- Chen, N.H., An Explicit Equation for Friction Factor in Pipe, Ind. Eng. Chem. Fund, Vol. 18, 1979.
The authors
Luke Matthews is a senior pipeline engineer with Kvaerner Hydrocarbons, UK, London.He joined Kvaerner in 1997 as a pipeline engineer. He holds a bachelor of mechanical engineering degree (honors) from the University of Newcastle-Upon-Tyne.
Gurdial Singh is a business managerpipelines, with Kvaerner Hydrocar- bons. He is resonsible for business development and the execution of pipeline systems and terminal-related projects. Singh holds a BSc (first class honors) in mechanical engineering from the City University of London and a diploma in management science from Henley Management College in the UK.
Mohammad Rasheed Jung is managing director of operations for Pak-Arab Refinery Ltd., Karachi. Previously, he was maintenance manager (1986-89) and senior engineer (1980-86) for the Abu Dhabi National Oil Co. Jung holds an MSc (1968) in electrical engineering from the University of Munich and is a registered professional engineer under the Pakistan Engineering Council and a senior member of ISA.
