Slower reserve growth rates observed in Volga-Ural Province, Russia
An understanding of reserve growth in known oil and gas fields has become a critical component of energy resource analysis.
Significant statistical studies of reserve growth have been published in the US, whereas little information is available on other regions of the world. It may be expected that in many countries the magnitude of reserve growth is different from that in the US because of differences in reporting systems and in exploration and production practices.
This article describes the results of a reserve growth study in a group of large oil and gas fields of the Volga-Ural petroleum province, Russia.
The dynamics of reserve growth in these fields shows rapid reserve additions during the first five years of field exploration and development, which result from intensive step-out and delineation drilling. Later reserve growth is slow and is related to improvements in recovery technologies and discoveries of new pools and extensions.
These two stages of reserve growth are described by two different groups of empirical models. A comparison of these models with the models developed for the Lower 48 states and Gulf Coast offshore of the U.S. demonstrates that the reserve growth in the Volga-Ural Province is significantly lower than in the US. The proposed models may be used for assessment of future reserve additions in known fields of countries that presently have or recently had a centrally planned economic system.
Introduction
Interest in reserve growth has gained momentum as petroleum experts around the world speculate on remaining oil and gas reserves.
Additional reserves of a province or country come not only from discovery of new fields but also from the reserve growth in existing fields. With the increasing exploration maturity of a petroleum province or country, like the US., the relative contribution of reserve growth in existing fields increases while that of newly discovered fields decreases.
Four main factors are largely responsible for reserve growth. These factors are:
- Reserve booking and reporting requirements,
- Improvements in reservoir characterization and simulation,
- Application of enhanced oil recovery techniques, and
- Discovery of new pools or extensions of known pools in existing fields.
The impact of each of these factors in reserve growth has never been statistically evaluated even for US provinces, and their relative importance remains largely unknown. However, it is obvious from the US data that booking and reporting of new reserves is the most important component during initial exploration and development of the field, and this component produces a rapid reserve growth in the first 5-10 years after field discovery.1 Other factors play major roles later in the field history.
Outside the U.S., no published work is available on reserve growth at a regional or country scale. Limited unpublished data indicate that in some regions, especially in those with a young exploration history (for example, the North Sea), the reserve growth may be substantially smaller than in the US, probably because of different reporting requirements and a better original definition of reservoirs using modern technology. In other regions of the world, a part of discovered reserves may not be reported for political reasons and, when reported, the real reserve number may cause an apparently large field growth.
Significantly different reserve growth histories may be expected in the Former Soviet Union (FSU) and in other countries, which presently have or recently had a centrally planned economic system (e.g. China). Reserve definitions and classification, booking and reporting requirements, and production practices in these countries differ significantly from those in the US and other free market countries.
In this article, we attempt to understand and model the main characteristics of reserve growth in Russia based on analysis of data from the Volga-Ural petroleum province. Data on this province are convenient for the reserve growth studies because all major fields were discovered in a relatively short time span of 10-15 years and the discoveries were made sufficiently long ago that reliable historical reserve data are available by field, which is required for reserve growth study.
We believe that the characteristics of reserve growth in the Volga-Ural Province will be representative of other regions of Russia as well as other countries of the FSU because of similarity in field development strategy and reserve reporting policies.
Volga-Ural geologic setting
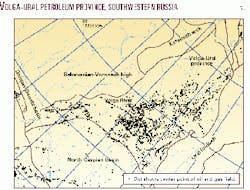
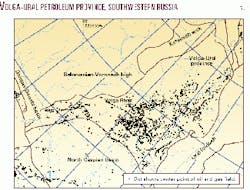
The Volga-Ural Province, which occupies a large area of European Russia, is located between the Ural Mountains and the Volga River (Fig. 1). Several Late Proterozoic rifts cut the Archean-Lower Proterozoic basement of the province. The Middle Devonian to Lower Tertiary sedimentary cover overlies the crystalline basement and early rifts.
The basal part of the sedimentary cover is composed of Middle to lowermost Upper Devonian siliciclastics known in Russian literature as the Clastic Devonian. This formation includes several regionally extensive sandstone beds that contain large oil reserves in structural traps. The principal reservoirs of giant Romashkino field (ultimate recovery about 18 billion bbl of oil) and several other large fields (Tuymazy, Novo-Yelkhovka, Shkapovo, and others) are in this formation.
Above the Clastic Devonian is the Upper Devonian-Tournaisian (Lower Carbonif erous) carbonate section that contains a variety of barrier and pinnacle reefs. The Domanik formation, main source rock of the province, occurs near the base of the section.2 Although this stratigraphic interval contains a number of fields, its productivity is limited by the absence of seals on top of many reef reservoirs.
Most of the oil migrated through the reefs into the overlying Visean (middle Lower Carboniferous) fluvial to paralic clastic formation. Visean rocks contain several giant fields (Arlan, Mukhanovo, Yarino-Kamennolog, and others) in structural traps and in drapes over the reefs.
Higher in the sedimentary succession is the Upper Visean-Lower Permian carbonate section, which is separated into two parts by clastic rocks of the Verey formation (Middle Carboniferous). The clastics form an important seal that caps the carbonate reservoir of large Kuleshovka oil field and reservoirs in several gas fields of the Saratov and Volgograd regions in the southwest of the Volga-Ural Province (Fig. 1).
A Lower Permian salt formation is present in the southeastern part of the province where it seals a number of gas fields including giant Orenburg (ultimate reserves 67.5 tcf) and much smaller Kopan (400 bcf) fields. The Upper Permian-Triassic interval is mostly a section of continental clastics derived from the Uralian orogen. The Mesozoic and Paleogene have been preserved from erosion chiefly in western and southwestern areas; Mesozoic rocks contain one of the gas reservoirs in large (2.4 tcf) Korobki field.
The Volga-Ural is the second (after West Siberia) most prolific hydrocarbon province in Russia with discovered ultimate oil reserves of 64 billion bbl and gas reserves of nearly 100 tcf. The first oil discovery was made in 1929 in a small Permian reef; however, the first large field was not discovered until 1944 when wells first penetrated the giant Devonian reservoir of Tuymazy field (more than 2 billion bbl of oil). Most of the other large and giant fields of the Volga-Ural Province, including giant Romashkino, were found in the following 10-15 years.
The Volga-Ural Province quickly became the cornerstone of the Soviet oil industry and remained the main oil producer until development of the West Siberian basin in the middle 1970s. The largest gas fields of the Saratov and Volgograd regions were also found soon after World War II, but giant Orenburg field, concealed by the deformed Permian salt formation, was not discovered until 1966.
Oil in Devonian reservoirs in large and giant fields of the Volga-Ural Province typically have API gravities ranging from 31 degrees to 41 degrees and sulfur contents of 0.5-2.0%.3 Oils in Carboniferous reservoirs usually are heavier (26.5 degrees in Arlan field), more sulfurous (up to 3%), and have higher viscosities. Regionally, oils become heavier northward and westward.
In the westernmost part of the Volga-Ural Province is the Melekes tar belt that contains huge resources of extra-heavy oil and tar in Permian carbonates and sandstones. More complete information on the geology and hydrocarbon productivity of the Volga-Ural Province published in English may be found in Peterson and Clarke4 and Ulmishek.2
Reserve growth background
No published studies on the reserve growth in Russian oil and gas fields are available.
In the US, Arrington5 was the first to recognize the significance of reserve growth. He developed a methodology for estimation of reserve growth in those fields for which reserve data for the early years after discovery are missing.
Marsh6 calculated cumulative growth factors for US oil and gas fields for a period of about 48 years after discovery and found that there were two separate reserve-growth cycles. The growth curve showed a rapid rise in the early years after discovery, flattened after 20 years and then began to show another rise for a few years before final leveling off.
Megill7 evaluated the reserve growth for US fields with reserves greater than 1 million bbl using Arrington's method. He evaluated the growth factors for the fields discovered after 1950 and found the annual growth to be higher and more erratic during the first 4-10 years than in the later years when the growth declined gradually.
Attanasi and Root8 developed a reserve growth model for oil and gas fields in the Lower 48 states discovered during 1900-91, based on their grouping of fields into two categories-common and outlier fields (outlier fields exhibit unusually high growth).
Later, Attanasi, et al.,1 reported the model-predicted field growth from the 1995 National Assessment of US Oil and Gas Resources and compared it with the observed field growth from 1992 through 1996.
The US Minerals Management Service also developed a field growth model based on data from offshore Gulf Coast.9 These two latter models are used below in comparing our models for the Volga-Ural Province.
Oil, gas reserve data
The data on fields of the Volga-Ural Province used in this study are current to Jan. 1, 1997. The data include year of discovery, first production year, cumulative production, and remaining reserves of Russian categories A+B+C1 and separately C2 on Jan. 1 of each year.
Russia's A+B+C1 category is roughly equal to US proved reserves, but the definition of proved reserves in Russia is substantially less restrictive than that used in the US.
The correlation between the Society of Petroleum Engineers proved reserves and the Russian A+B+C1 reserves is complex because the two classifications are built on different principles as discussed in detail by Grace et al.10
The Russian classification is based primarily on the degree of reservoir geological knowledge and to a far less extent on economic factors of hydrocarbon recovery.
In general, A+B+C1 category corresponds to SPE's proved and a part of probable reserves, whereas C2 category covers parts of probable and possible reserves. The A+B+C1 reserves have been used for calculating reserve growth in this study.
Based on data from the West Siberian basin, Nemchenko et al.11 concluded that statistically 70-75% of C1 category falls in SPE proved reserves.
An even more complex situation is characteristic of gas reserves. Although proved gas reserves in the Russian classification are similar to oil reserves A+B+C1 in terms of geologic certainty of their existence, they are actually in-place amounts, thus assuming 100% recovery. Probably, this historically stems from the abundance and low cost of natural gas in the Former Soviet Union.
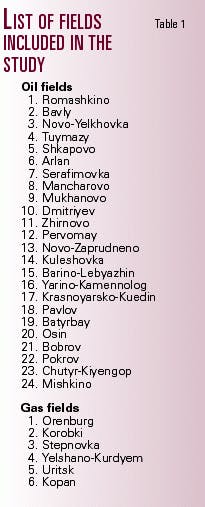
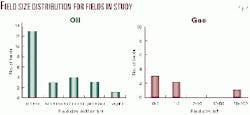
Several hundred oil and gas fields have been discovered in the Volga-Ural Province. For this study we used data from 24 oil fields and 6 gas fields (Table 1). Although this number of fields is small when compared to the total number of discoveries, all oil fields and most of the gas fields included in the study are large.
The reserves of individual oil fields vary between 250 million and 18 billion bbl and gas fields between 400 bcf and 67.5 tcf. Combined, these fields contain almost 60% of oil and more than 70% of gas reserves of the Volga-Ural Province (Fig. 2).
Methodology/data processing
To calculate reserve growth for 24 oil fields, a spreadsheet was prepared that includes reserve estimates for each field by year since the effective discovery date.
The reserves of all the fields are added by year, and the annual reserve growth of a particular year is calculated by taking the reserve number of that year and dividing it by the previous year's reserve number. For the discovery year (shown as a zero year), the annual growth is 1.
Cumulative reserve growth for any year is calculated by multiplying the annual growth factor of that year by those of all the previous years. This procedure gives volume-weighted reserve growth factors. Similar calculations were made for 23 oil fields excluding Romashkino field and separately for the gas fields.
Under the USSR's centrally planned economic system, the exploration phase in a newly discovered field always preceded the field development and production. During this phase, a certain number of wells were drilled on the structure and tested to provide adequate information for reservoir delineation and reserve estimates.
It took several years to evaluate a field in Russia, and during that time reserves were reported on an annual basis. In some fields, the exploration drilling after discovery was postponed by several years; therefore, very low reserve numbers were reported during that time, and these numbers significantly distort the growth estimates.
Therefore, the discovery year for each field was re-defined by ignoring the low reserve values in the first few years and taking the first significant reserve-reporting year as the discovery year. Since this first significant reserve-reporting year is comparable with the discovery year for US fields, it is called the effective discovery year.
In the FSU, the reserve numbers reported during early years after discovery were considered unofficial until these numbers were confirmed by the State Committee on Reserves. Under conditions of the centrally planned economy, the first reserve confirmation by this committee was an important point in field life.
The law required that by the time of data presentation to the State Committee, a certain amount of exploration should be completed. The reservoir or a major part of it had to be delineated based on drilling and well test results. Also, a certain minimum number of rock and fluid samples had to be analyzed and pressure and temperature measurements had to be made.
After the confirmation, producing organizations were permitted to start the development drilling and production. Therefore, the reserve confirmation marked a point when the reserve growth related to step-out drilling into a particular reservoir was finished.
Further reserve growth for the reservoir or its part could occur for reasons other than field development. Usually, during the first few years after discovery, all significant reservoirs of the field were explored, resulting in termination of the rapid reserve-growth stage.
Because of uncertainties in reserve reporting before the confirmation by the State Committee, we also calculated the cumulative reserve growth considering the first year of production as the effective discovery year. However, the first production year usually coincides closely with the first reserve confirmation year.
Reserve growth was calculated for reserve A+B+C1. Although this category does not directly correlate to SPE proved reserves, it is sufficiently well defined to analyze reserve growth. The span of years used to estimate annual and cumulative growth factors in this study were defined by the shortest production history, in years, for any one field.
This criterion resulted in 29 years of reserve growth data for the case with the first significant reserve-reporting year as the effective discovery year, and 24 years for the case with the first production year as the effective discovery year. For gas fields, only 18 years of data were available for study.
Results
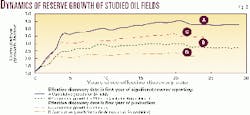
We plotted cumulative growth factors for oil reserves against time for both the first significant reserve-reporting year and the first production year as the effective years of discovery (Fig. 3). Fig. 3 also illustrates the change of cumulative growth factors for all 24 fields in our database and separately for 23 fields without giant Romashkino oil field.
Because of its size (nearly 18 billion bbl reserve), Romashkino field data heavily influence the entire data set.
Romashkino contains more than 400 oil pools in Devonian and Carboniferous rocks, and new pools continue to be discovered annually.12 However, about 85% of recoverable reserves are found in a less than 50 m thick clastic interval at the base of Upper Devonian rocks.13 Net thickness of sandstones in the interval averages 18 m (59 ft).
The field occupies the crest of a regional arch in the northwestern part of the province and covers a huge area of 4,225 sq km (1,632 sq miles). A part of reserve growth in this field, which is caused by step-out and delineation drilling during the first several years after discovery, was substantially larger than similar growth in the other large fields of our data set.
The sections of the growth curves starting from the fifth-sixth year after the effective discovery year show fairly similar reserve growth trends. All of them demonstrate a modest increase in the cumulative growth factors after the initial rapid growth that is related to step-out and delineation drilling. This increase is somewhat larger for all 24 fields of our data set than for the 23 fields without giant Romashkino.
At the same time, the absolute magnitude of the growth factors varies substantially. Also, it is larger if the first significant reserve-reporting year, rather than the first production year, is considered as the effective discovery date. The decrease in reserves on the 20th or 21st year after the effective discovery date, seen on all curves, is mainly due to re-assessment of reserves at Arlan, second largest field in the Volga-Ural Province.
At Arlan, the main oil reserves are in Carboniferous sandstones at 1,100-1,200 m (3,608-3,936 ft).14 The oil is relatively heavy (26.5 degrees ), its viscosity ranges from 20-25 cp at reservoir conditions, and it has a low gas-oil ratio (85-100 cu ft/bbl).
The field was produced under waterflood from the first year after development. Reservoir rocks are primarily alluvial sandstones with laterally and vertically variable permeability. Less permeable sandstones responded poorly to waterflooding, which resulted in a downward revision of reserves.12
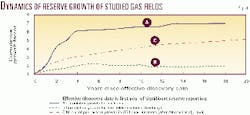
Fig. 4 shows a plot of cumulative growth factors for all six gas fields in our data set and for five smaller fields, excluding giant Orenburg field. Orenburg occurs in an elongated regional arch. The massive gas pool is in the top part of the Carboniferous-Lower Permian carbonate section overlain by a thick salt formation. The pool is 107 km (69 miles) long, 22 km (14 miles) wide, and 275-525 m (900-1,720 ft) high.15
The field's gas reserves (67.5 tcf) are so much larger than all other fields in our data set combined that these reserves dominate the shape of the upper curve (a) in Fig. 4. Probably, the lower curve (b) for the five much smaller but still significant (0.4-2.4 tcf) fields is statistically more representative. The lower curve (b) shows moderate reserve growth in the first few years of exploration and then a gradual decrease during the next 12-13 years of production.
This decrease can be attributed to the fact that reported gas reserves are actually gas-in-place values, and 100% recovery cannot be achieved by the time of field depletion.
Reserve growth models
Because the data demonstrate a rapid oil reserve growth in the first five years and a gentle growth over the rest of the producing life, no single equation showed a satisfactory fit with the reserve growth curves. Therefore, each proposed model includes two separate equations to simulate the two sections of the curve with widely different rates of reserve growth-one for the first five years and one for the sixth year onward.
Rapid reserve growth during the first five years after discovery is characterized by large variations in the annual growth factors, and to model this part of the growth, an equation was developed to match the annual growth factors. To model the reserve growth in the years following the fifth year, another equation was developed to match the cumulative growth factors.
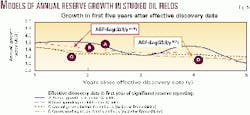
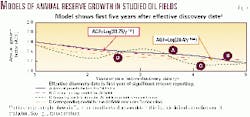
Fig. 5 shows a plot of two annual reserve growth factors for the first five years after the effective discovery year. The effective discovery year for this plot is the first year in which significant oil reserves were reported in the fields and after which the rapid growth of reserves occurred. The two curves are shown in Fig. 5-one for all 24 fields of our data set and one for 23 fields excluding Romashkino. Two respective best-fit model curves and their analytical expressions are also shown on the plot.
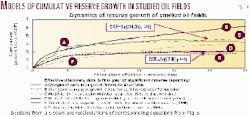
Fig. 6 shows cumulative growth factors (CGF) and respective models for further oil reserve growth starting from the sixth year after the effective discovery date, based on first significant reserve reporting year as the effective year. The equations used in these two models for all 24 fields and for 23 fields without Romashkino are:
For 24 fields:
CGF = 1n [(14.3)(y0.56)] - (1)
For 23 fields:
CGF = 1n[(7.8)(y0.3)] - (2)
where y is the year since the effective discovery date, starting from the sixth year.
Data and models for the first five years in the Fig. 6 are recalculated from Fig. 5. As discussed above, modeling of reserve growth from the sixth year onward is made for the cumulative, rather than annual, growth factors. Oil reserve growth models for both US lower 48 states1 and Gulf Coast offshore9 are shown for comparison.
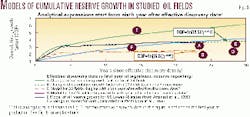
Figs. 7 and 8 demonstrate models similar to those shown in Figs. 5 and 6, re spec tively, but unlike in Figs. 5 and 6 the effective discovery date for these plots is the first year of production. The equations for the models of oil reserve growth starting from the sixth year that are shown in Fig. 8 are:
For 24 fields:
CGF = 1n[(9.5)(y0.45)] - (3)
For 23 fields:
CGF = 1n[(6.6)(y0.18)] - (4)
where y is the year since the effective discovery date, starting from the sixth year.
Data and models for the first five years after the effective discovery date in Fig. 8 are recalculated from Fig. 7. Both models of oil reserve growth for the U.S. are also shown in Fig. 8.
Discussion
The four models of field growth presented for the fields of the Volga-Ural Province (Figs. 6 and 8) differ significantly from each other only in the first four to five years after the effective discovery year.
The prediction of field growth during this short period of time contains uncertainties that are related to the problem of defining the effective discovery year.
However, recent discoveries in the province are few and relatively small. Therefore, it is believed that the models for 23 fields without Romashkino (Figs. 5 and 7) will better predict the growth of new discoveries in the first five years.
During the period beyond five years after discovery, there is little difference in the model-forecasted reserve growth factors for all four models (equations 1, 2, 3, and 4), and they all show flattening of the curves.
However, they differ significantly from models for the US Lower 48 states1 and for the offshore Gulf Coast fields,9 which both show continuous reserve growth after many years of production (Figs. 6 and 8).
The lower tilt of the reserve growth curves for the Volga-Ural Province indicates that the rate of reserve growth is significantly lower here than it is in the US.
These differences in statistical growth could be attributed to differences in the reporting systems and in exploration and production practices.
Comparison of results from models in Fig. 6 with the corresponding observed data shows that the reserves of Volga-Ural fields declined slightly seven to eight years ago (due to re-assessment of Arlan field) and then remained flat, whereas the models show limited, but continuous growth.
The most probable reason for this divergence of the model curves from the observed data is economic and political problems in Russia. There are strong indications that reserve growth can be re-established if more investments in modern production technologies are made.
Data analysis suggests that many of the Volga-Ural oil fields of our data set do have the potential for further reserve growth. Plots of production rate versus cumulative production for a number of fields show an unexpected sudden drop in both the production rates and the remaining reserves in the last 5-10 years.
It is difficult to be specific about the reason for this rate/reserve drop without reviewing the reservoir and operational conditions for individual fields, but it seems that the fields can improve their performance through redevelopment and improved recovery methods.
The model presented in this report suggests that ultimate reserves of the 24 oil fields of our data set will increase from 5,277 million tons to 5,383 million tons (approximately 38.52 billion bbl to 39.30 billion bbl), or by 2% during 1997-2005. This constitutes an average growth of 0.25%/year.
For comparison, fields discovered before 1977 in the US Lower 48 states grew by 0.84%/year during 1977-1991.8
The available data on gas fields of the Volga-Ural Province (Fig. 4) are insufficient to develop a model for reserve growth. Apparently, after the initial growth that resulted from step-out and delineation drilling, no further reserve growth is observed.
On the contrary, reserve decrease (negative growth) took place. As discussed above, this negative growth is primarily due to the impossibility of complete extraction of in-place gas that constitutes the reported reserve number.
The preliminary analysis suggests that the models created for the Volga-Ural Province may be used to forecast the future reserve growth in other provinces, that were developed under conditions of the centrally planned economic system.
This is especially true for those parts of the models that describe the reserve growth after completion of the initial exploration phase. This phase starts from the sixth year after the effective discovery date in the Volga-Ural Province, but the starting year could be different in other regions.
The models for 23 fields without giant Romashkino seem to be more applicable to other regions devoid of growing fields of this dimension.
Models for the first years of rapid reserve growth are less reliable than the ones for later phase. The models are sensitive to definition of the effective discovery year and vary depending on exploration conditions such as remoteness of the area from infrastructure, availability of capital, etc.
These models will probably better describe reserve growth in other regions if the effective discovery year is defined as the first production year. This will eliminate the many idle years during which remote fields commonly await development.
Acknowledgments
We thank the reviewers, T.S. Dyman and M. Henry of the USGS, for their valuable comments and suggestions. We also thank other USGS staff for their assistance in preparing this article.
References
- Attanasi, E.D., Mast, R.F. and Root, D.H., "Oil, gas field growth projections: wishful thinking or reality," OGJ, Vol. 97, No. 14, 1999, pp. 79-81.
- Ulmishek, G.F., "Upper Devonian-Tournaisian facies and oil resources of the Russian craton's eastern margin," in McMillan, N.J., Embry, A.F., and Glass, D.J., eds., "Devonian of the world. I. Regional syntheses," CSPG Memoir 14, 1988, pp. 527-549.
- Trebin, G.F., Charygin, N.V., and Obukhova, T.M., "Oils in fields of the Soviet Union" ("Nefti mestorozhdeniy Sovetskogo Soyuza"), Nedra, Moscow, 1980, 584 p. (in Russian).
- Peterson, J.A., and Clarke, J.W., "Petroleum geology and resources of the Volga-Ural Province," US Geological Survey Circular 885, 1983, 27 p.
- Arrington, J.R., "Size of crude reserve is key to evaluating exploration programs," OGJ, Vol. 58, No. 9, 1960, pp. 130-134.
- Marsh, R.G., "How much oil are we really finding," OGJ, Vol. 69, No. 14, 1971, pp. 100-104.
- Megill, R.E., "Smoothing reserve rates helpful," AAPG Explorer, Vol. 10, No. 4, April 1989, pp. 46-47.
- Attanasi, E.D., and Root, D.H., "The enigma of oil and gas field growth," AAPG Bull., Vol. 78, No. 3, 1994, pp. 321-331.
- Lore, G.L., Brooke, J.P., Cooke, D.W., Klazynski, R.J., Olson, D.L., and Ross, K.M., "Summary of the 1995 assessment of conventionally recoverable hydrocarbon resources of the Gulf of Mexico and Atlantic continental shelf," Minerals Management Service, OCS Report MMS 96-003, 1996, Appendix A.
- Grace, J.D., Caldwell, R.H., and Heather, D.I., "Comparative reserves definitions: USA and the Former Soviet Union," JPT, Vol. 45, No. 9, 1993, pp. 866-872.
- Nemchenko, N.N., Zykin, M.Ya., Gutman, I.S., and Poroskun, V.I., "Comparison of resource and reserve classifications in Russia and the USA," Geologiya Nefti i Gaza, Vol. 8, Nos. 20-24, 1996, pp. 20-24 (in Russian).
- Gavura, V.E., ed., "Geology and production of the largest and unique oil andoil-gas fields of Russia" ("Geologiya i razrabotka krupneyshikh i unikalnykh neftyanykh ineftegazovykh mestorozhdeniy Rossii"), VNIIOENG, Vol. 1, Moscow, 1996, 277 p. (in Russian).
- Muslimov, R. Kh., "Influence of geologic framework on the effectiveness of production of the Romashkino field" ("Vliyaniye osobennostey geologicheskogo stroeniya na effektivnost razrabotki Romashkinskogo mestorozhdeniya"), Kazan University, Kazan, Russia, 1979, 212 p. (in Russian).
- Maksimov, S.P., ed., "Oil and gas fields of the USSR" ("Neftyanye i gazovye mestorozhdeniya SSSR"), Nedra, Vol. 1, Moscow, 1987, 358 p. (in Russian).
- Zhabrev, I.P., ed., "Gas and gas condensate fields" ("Gazovye i gazokondensatnye mestorozhdeniya"), Nedra, Moscow, 1983, 375 p. (in Russian).
The authors
Mahendra K. Verma is a research scientist with the US Geological Survey in Denver. He has worked with the Energy Resources Team since June 1998. He has more than 26 years in the industry, including 9 years with Mobil E&P and 10 years with Qatar General Petroleum Corp., now Qatar Petroleum. He has petroleum engineering degrees or diplomas from Indian School of Mines, Imperial College of Science & Technology, and Birmingham University. E-mail: [email protected]
Gregory F. Ulmishek is a research geologist with the USGS in Denver. After a 20 year career as an exploration and research geologist in the USSR, he immigrated to the US in 1980 and was employed by Argonne National Laboratory. He joined the USGS in 1987 as a member of the World Energy Resources Program. He studied basins of the Former Soviet Union, Arctic, and China. He is now regional coordinator for the Former Soviet Union. He has an MS degree in geology from Moscow Petroleum Institute and a PhD degree from the Institute of Geology and Exploration for Fossil Fuels.
Andrei P. Gilbershtein is a department chief at the head Research Information Computer Center (Glav NIVC) of the Russian Ministry of Natural Resources. He studied the application of mathematical methodologies for planning and estimation of efficiency of exploration for oil and gas. Presently he is involved in developing databases on economics of petroleum exploration and resource base in basins of Russia. He has an MS degree in economics from the Moscow Institute of Petrochemical and Gas Industry and a PhD degree from the All-Russia Institute of Economics of the Mineral Resources.
This material was prepared for presentation at the 2000 SPE/AAPG Western Regional Meeting in Long Beach, Calif., June 19-23, 2000.
