Oil prices enter a new era of increased volatility

In theory, price volatility should be relatively unimportant to the oil industry. In reality, it represents a challenge the industry has had a difficult time meeting.
When the price of oil collapsed in 1998, not only did few forecasters predict it-or correctly anticipate the subsequent recovery-but many prominent analysts expected prices to remain low for years.
The industry's reputation for boom and bust hiring and firing was reinforced (negatively) by its behavior 2 years ago, when thousands were laid off.
Now, of course, the industry is struggling to find crews and rigs and must pay exorbitant prices to attract them, as all too many reject the wages offered, expecting yet another round of layoffs and dislocations when lower prices return.
The latest cycle also raises questions about the longer-term market. The recent price surge is reviving arguments dating back to the 1970s as to whether "this" spike finally represents the long-awaited (and inevitable) move to a rising price trend. But even if it doesn't, and the price reverts to the current mean, could there be a new, higher mean being established?
Beyond the question of price levels, the industry must consider that this level of volatility could be the new norm. This article will address the reasons prices have been more volatile recently, whether that volatility will continue, and whether or not there is a new mean.
History of price volatility
Before 1974, non-US prices were not considered very meaningful, and many held the attitude that "only fools and affiliates pay posted prices." Prices didn't change much in the short term, and it was not unheard-of for multiyear oil and gas contracts to include fixed prices. Most international price data for this period is lacking.
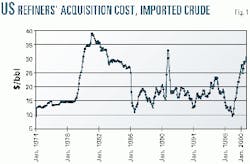
But after 1974, prices were actually quite stable until the Iranian oil crisis, as illustrated in Fig.1. The graph shows US refiners' monthly average acquisition prices for imported crude oil.
The stability of prices changed in 1986, however, primarily because the Saudis abandoned the role of swing producer, while the Organization of Petroleum Exporting Countries changed from effectively setting the price and letting production fluctuate (during 1974-85) to setting production quotas and letting the price fluctuate after 1986.
This alone guaranteed increasing price volatility, but a number of other changes enhanced this transformation to a period of more volatile prices, including the growing amount of market-sensitive non-OPEC production.1
Few people realize that most oil, including OPEC oil, produced in the 1970s was sold at fixed prices, due to price controls in the US and other countries. Also, the Third World, non-OPEC producers (price takers) were still very small, with much of their production consumed domestically.
However, by 1986, price controls had been abandoned in the US and elsewhere, while the growth of North Sea and Third World, non-OPEC production to 12.5 million b/d from 7.5 million b/d-most of which was never under price controls-greatly increased the amount of crude being produced and sold at market prices.
At the same time, the spot market went from being a minor balancing tool to a major part of the oil market. In the 1970s, spot crude sales were estimated at 3-5% of the market, while they have been on the order of 25-35% since the second oil crisis.
In part, this reflected increasing spot sales from OPEC countries, as they increasingly took control of the sale of their own oil but lacked sufficient downstream assets to absorb it. In addition, the large oil companies realized that it was no longer necessary to keep their crude production within their own systems, and the engineering and economic advantages of dedicating a crude stream to a particular refinery had declined with advances in refining technology and greater regional price disparities.
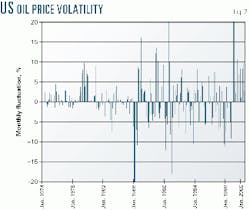
Thus, prices began to cycle in the short term, not just daily and weekly, but longer-term as well (Fig. 2). Average monthly fluctuations went to 5.3% during 1986-95 (excluding the Persian Gulf crisis) from 1.2% in 1974-85 (excluding 1979-80).
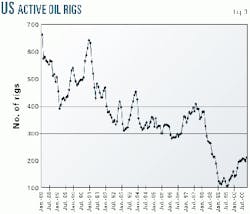
Although most of these movements were considered minor compared with the two oil-price shocks, the fact that prices fell and rose by 30-50% on five occasions is noteworthy. This trend also influenced industry profits and behavior, with US drilling, for example, cycling up and down with prices for many years. (Fig. 3) Aside from the human costs, volatility in industrial activity is economically inefficient, as it means that planning is difficult and factor costs unpredictable, changing with demand.
Decline in capacity
The market lately seems to have entered a new period-in two dimensions:
- Prices appear to have become even more volatile.
- More-volatile prices now show an upward movement that was lacking earlier.
The reasons are fairly straightforward and can be categorized as both physical and behavioral.
The most obvious change has been the decline in surplus capacity in the industry.2 The enormous amount of surplus capacity at all levels has been so persistent that many have grown up with it and consequently have come to think of it as normal. It is, in fact, a divergence, both from what is desired by market players and from what should occur under competitive conditions.
Disequilibrium is abnormal and, theoretically, self-correcting. However, such a correction has not been in evidence in past oil markets for a variety of reasons.
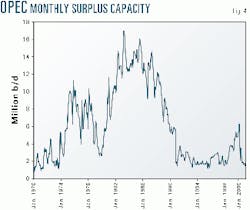
This was true of all levels of the industry. Fig. 4 shows the estimated amount of surplus crude production capacity in OPEC over the past 30 years, the gradual decline after the 1986 oil price collapse, and the sharp drop caused by damage from the Persian Gulf crisis.
Outside of OPEC, there has not been any significant amount of surplus crude oil producing capacity, although for many years (and for reasons similar to OPEC's)3 Texas maintained a fair amount under Texas Railroad Commission (TRC) production allowables.
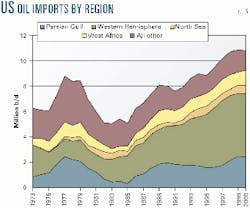
In addition, there remained an enormous surplus of tankers for many years, so much so that shipping rates remained depressed for about 2 decades. This resulted from a combination of the slowdown in demand in the early 1980s and the great increase in short-haul crude in the Atlantic basin, with US crude imports shifting from the Middle East in the late 1970s to Canada, Mexico, and other nearby sources in the 1980s (Fig. 5).
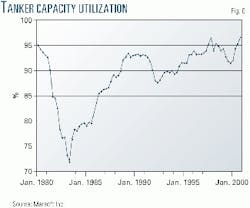
But utilization here, too, has recovered (Fig. 6) and has been compounded recently by efforts to retire older, less reliable ships, so that VLCC (very large crude carrier) rates in 2000 were at the highest since the Persian Gulf crisis in 1990.
And of course, global refining has been abysmally depressed. The impact of the reductions in demand in the late 1970s was worsened by the industry's refusal to believe that oil would respond to higher prices the way other commodities do.
Even in the US, refining capacity continued to increase, as utilization rates plummeted from the mid-1970s. And refining capacity continued to grow in many countries because of protection from product imports or-in oil exporting countries-subsidies, while other nations resisted closing refineries with idle capacity, particularly in Europe.
The situation has changed slowly, beginning with decontrol in the US in the early 1980s, which closed the many "teapot" refineries that had been operating under price controls and entitlements. Also, gradual reform in Europe and Asia, a reduction in capacity additions within OPEC, and, especially, a growth in global oil demand have worked to cut the surplus.
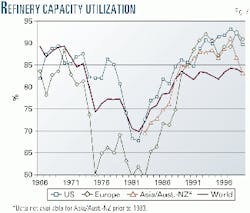
Although the recovery has been delayed by capacity creep, it now appears that capacity factors at a global level might have returned to an equilibrium level, as Fig. 7 shows.4 While this might be reversed with new building or capacity expansions,5 it will be necessary to develop new export refineries. However, public resistance to construction in developed nations-the "Not in my back yard!" syndrome-remains a problem, despite rising consumption.
Product regulations
The lack of surge capacity in the oil industry has been exacerbated by the widespread increase in the stringency of environmental standards. There have been reductions required in the amount of pollutants, such as sulfur, allowed in fuels and requirements for additional, more-varied gasoline formulations, depending on both the season and region. The result is an increasingly fragmented market with a greater potential for localized supply problems.
The impact on price volatility is significant. Storage capacity must sometimes be emptied to make room for supplies formulated for the coming season, resulting in inventory dumping and price declines. But also, market imbalances-shortages, really-have become much more difficult to address because supplies that might previously have been shipped in cannot now be used due to environmental regulations.
Not only will higher transportation costs drive up retail product prices, but the tightness in infrastructure (tankers, pipelines) means greater difficulties in delivering products to offset imbalances. This means a price response, such as that which occurred last summer in the US Midwest, is necessary to balance the market.
Although these kinds of problems are, in effect, "micro-bursts" that have no great impact at the national and global level, the likely increase in their occurrence in coming years probably means slightly higher average product prices and thus, higher refinery and retail margins.
The US regulations also present a barrier to entry for products from other markets. This will probably also increase the differential between light, sweet and heavy, sour crude oils internationally, but will apply only to the cost of processing, on average. And the industry's history of overbuilding capacity while upgrading facilities remains a threat to depress differentials for extended periods.6
Behavioral changes
Changes in the physical market are also being compounded by some behavioral changes, the most important of which is a change in the level of desired inventories.
Because of the many factors that determine the industry's desired inventory levels, it is difficult, if not impossible, to describe a general rule, using prices and costs, that will forecast demand for inventories. However, recent behavior implies a change in the industry's approach to inventory usage.
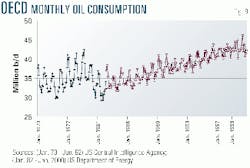
When the oil industry was integrated and owned concessions in the Middle East, it made economic sense to optimize by holding inventories instead of using production capacity to meet seasonal fluctuations in demand, especially given that heating oil demand was much higher at the time, relative to the present. Fig. 8 shows consumption figures from the early 1970s, the earliest data available on a monthly basis.
However, as companies have lost the bulk of their Middle East holdings, and OPEC nations have (involuntarily) become the residual suppliers, it has become cheaper for the international industry to make them the surge suppliers, rather than to hold inventories.
Fig. 9 shows US crude and product inventories (excluding the Strategic Petroleum Reserve), relative to crude runs and product supplies, respectively. They are much lower now than in the past. After the buildup during the Iranian oil crisis, absolute inventories fell, but relative inventories did not decline as much, and crude inventories remained fairly high, above the pre-1979 level, until the mid-1990s.
These levels were due to a combination of factors, including the fact that the major oil companies, even after the nationalizations of the early and mid-1970s, were still receiving most of their crude from their former equity partners through long-term contracts. These were largely canceled or sharply curtailed in 1979-80, and companies had to rely much more on the spot market.
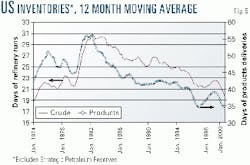
In addition, many shifted from the practice of keeping their crude within their systems to allowing regional and sectoral independence. Any given refiner or producing operation could buy or sell according to the local market, and most did. However, the resulting lower certainty about deliveries may explain the slow decline in crude inventories after 1987, seen in Fig. 9, because companies wanted to offset less certain stocks-at-sea with those on land.
Other factors that might have influenced desired (or operational) inventory levels include the shutting down of many small refineries in the US after price deregulation, more refinery flexibility, and better information within corporations due to computer networks. All would have improved the ability of the industry to operate with smaller inventories.7
But it was only in 1996 that behavior changed regarding crude oil inventory, causing it to fall below the level of the mid-1970s. The oil industry, partly reflecting a greater pressure to increase profitability, has in recent years moved to what is referred to as "just-in-time" inventories. The average inventory level (in days of consumption) dropped sharply in the mid-1990s and recovered in 1998-99, when OPEC overproduction resulted in full tanks, before falling precipitously with the OPEC quota cut in spring 1999.
The implication for future price behavior is that swings in demand, even predictable seasonal swings, will increasingly be met by price changes, rather than delivery from storage. This was certainly the case last summer in the US Midwest gasoline market and, to a lesser extent, last winter in the heating oil market. But it also means that prices are likely to be downwardly volatile as well as upwardly, because the end of seasonal demand for a product could lead to its being dumped onto the market by companies less willing to hold inventories for an extended period.
The lower level of desired inventories also complicates OPEC's attempts to stabilize prices. Because market transparency is, if anything, declining, and companies are quicker to reduce purchases when their inventories reach desired levels; then prices are likely to drop faster and more unexpectedly.
Unreliable data
Another behavior element is linked to market uncertainty based on a combination of factors. Although prices have become much more transparent, with the average high school student being able to download better price information over the internet than a learned professor could gather 3 decades ago, other data are more elusive.
Oil production data remains uncertain and subject to revision, even in the Organization for European Cooperation and Development countries.
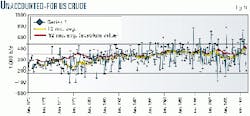
Currently, US production data varies depending on the source, reflecting the fact that there is no "official" source for production data at the national level in the short term; even the US Department of Energy estimates monthly production until the following year. Although the spread between estimates for the US is only about 80,000 b/d, or 1.3%, if extrapolated to a global level, that percentage would be equivalent to 1 million b/d. And the unaccounted-for crude, which DOE uses to balance supply and imports, is rather large for a networked economy (Fig. 10).
And of course, the continued conflicts over OPEC production quotas has meant that the members' production data are uncertain and likely will be for some time. Even tanker watchers have found that they are only marginally able to estimate actual exports and must revise their figures regularly. Research at WEFA finds that a difference of about 300,000 b/d among the major sources is typical.
Oil consumption data also remain unreliable, with most developed nations reporting deliveries, which includes secondary and tertiary stock changes, while developing countries generally rely on trade (mainly import) data.
Because the proportion of the world's oil consumption occurring in nations with poor data-collection systems has grown to 38% today from 30% in 1985 (according to the best estimates), the uncertainty level has increased correspondingly. Given the apparent rise in smuggling in some parts of the world and the fact that most monthly and quarterly estimates are made using seasonal adjustment factors rather than actual monthly data, it is not surprising that the discrepancies among world oil production, consumption, and inventory change has grown.
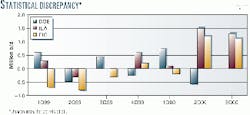
Examples of such statistical discrepancies (sometimes referred to as "missing barrels") can be seen in Fig. 11. These figures, reported by the US Department of Energy (DOE), the International Energy Agency (IEA), and the Energy Intelligence Group (EIG), represent the difference between consumption and production that does not appear in inventory changes. The figures vary substantially, both over time and between sources, and there remains a strong disagreement among analysts over the nature of the discrepancy, that is, whether it represents erroneous reporting of production or consumption or actual oil that has not been measured.
The amount, however, is clearly significant, especially if-as appears to be the case-the industry is becoming more sensitive to "following the marginal barrel," that is, having the price move more quickly in response to surplus or shortages. Note that the most recent estimates of the discrepancy are higher, in part, because the data are more recent.
Future volatility
The implication of this analysis is that oil prices are likely to remain as volatile in the future as in the past few years, despite the professed desire for stability by both consumers and producers. Petroleum is a commodity, and fluctuations in supply and demand, often unpredictable, mean that volatility is to be expected. And this uncertainty about near-term behavior (backwards as well as forwards) means that OPEC will never be able to completely stabilize the market.
The importance of the marginal barrel has greatly increased in both weak and tight markets. The industry's decision to reduce costs by lowering inventory levels means that a small surplus will put more pressure on prices than it did in the past. Companies will be quicker to cut purchases or look for bigger discounts when they have reached what they consider the necessary amount of oil in storage.
But on the upside, the lack of surplus inventory, combined with minimal surge capacity in production, shipping, and refining also means that there will be more-frequent and relatively more-severe price spikes than in the 1985-95 period. Even ignoring the role of formula-driven local price spikes, the market has become more reliant on higher prices to deal with a mismatch in supply and demand.
And the size of the mismatch that will cause a price spike has declined. In the past, it took a major loss of supply to affect the market, including revolution in a large OPEC country or a severe recession in Asia. But because of the fragmentation of the market and the lack of storage and surplus capacity, the size of supply disruptions or demand surges necessary to have a significant price impact is much smaller today than it was 10 years ago.
This implies that the combination of "just-in-time" inventories and more-stringent formulas for light products will likely mean an upward bias for oil prices compared with the previous cyclical behavior. To restore the market balance, weak markets require only a production cutback (by crude producers or refiners, depending on the market that is weak), with a lag time for the cuts.
While tight markets require a similar lag time for production increases to restore equilibrium, there is an important asymmetry here. Because markets often will not have inventories at hand, not only will there be a lag after production increases, but in many cases, investment in new capacity will be necessary. This is a much more difficult and lengthy process than altering production levels, and explains why the world oil market has moved back towards moderate prices, but US natural gas markets are expected to remain above the long-term mean for much longer.
And because capacity is costly, seasonal price spikes are unlikely to be met by new investment. No one will add a hydro treater to respond to a weather-related price spike, for example, or build tankers in response to short-term market moves. But it must be admitted that the industry has a long history of overreacting to price spikes and overbuilding.
Where's the mean?
Given this higher volatility-even if the market is considered to still be mean-reverting-the question becomes whether or not the mean will be higher than in the past, and if so, why? In fact, market structure is very important to establishing the mean price in different periods.
Although there is general recognition that inflation-adjusted prices have not changed much in the industry's history, they often vary from the historical mean for lengthy periods, and certainly within the past 30 years.
During 1900-70, the average real US wellhead oil price was $15.50/bbl, while during 1970-2000 it was about $23, despite the years of price controls. This primarily shows the importance of market structure and reflects the end of TRC's power, combined with a shift in OPEC from competition for market share to cooperation in stabilizing markets at higher prices.
More recently, looking at monthly prices, there is a clear pattern for mid-1986-95. Although it appears to be cyclical around a mean of $17.50/bbl, the truth is that the industry's surplus capacity resulted in constant periods of weakness and recovery, not periods of strength followed by weakness (granted, this judgment is subjective). Prices were not going up and down around a mean so much as dropping from a ceiling, then being restored by market forces or OPEC action. Except during the Persian Gulf crisis, there was never really a tight market before 1996.
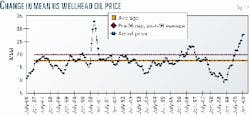
The implication is that the restoration of the physical market to equilibrium, that is, the end of the lengthy period of surplus capacity, means that it is now possible for markets to be tight and prices to occasionally cycle upwards, then return to the mean. Thus, as shown in Fig. 12, the price of $20/bbl oil during 1986-95 was the ceiling, but now it looks more like a new mean. And periods such as 1996 and 2000, when prices rose above it, will be more common.
The mean price, then, goes to about $20/bbl from $17.50/bbl. This is neither earth-shattering, a vindication for the price forecasters of 2 decades ago, nor confirmation of the new Malthusians' warnings. Nevertheless, in terms of industry cash-flow and profits, neither is it trivial.
Coping
Companies and governments can simply rail against the unfairness of the market, accuse it of being imperfect or manipulated by speculators, claim that the production and consumption data are misleading or falsified, and complain about the relative prices of crude oil and mineral water-or they can adopt a more-effective strategy.
Everyone should recognize that short-term price fluctuations are short term and not overreact to them. There is no evidence that prices have ceased to be mean-reverting, that is, that high prices are not more likely to decline, and low prices to rise; therefore, companies should try to develop buying and selling strategies that both protect them from losses and enable them to profit from the volatility. The former involves maintaining insurance and should be mandatory. The latter is more optional.
Insurance consists of a variety of hedging, including the use of futures markets. Many companies do not hedge following bad experiences, but for smaller companies in particular, hedging can provide valuable insurance. They must be careful, though, not to confuse hedging with speculating. Too many companies only hedge at one end of the market, usually the wrong end, as was seen in 1999.
Contract flexibility plays a valuable role as well. Maintaining a core of purchase and sales contracts on a longer-term, fixed-price basis allows for cost stability, while having a fraction that are short-term in nature or expire regularly provides an opportunity for the company to adjust its costs. These can also apply to services such as leasing drilling rigs and to employees.
And the ultimate insurance is size, as cyclical losses are much less damaging to companies with deep pockets. Their financial power also makes them better placed to take advantage of the boom years-a lesson every farmer knows. Conservative budgeting can provide some protection but does leave the company open to greenmail or acquisition-the latter not necessary a negative.
Profiting from volatility is more problematic than insuring against it and is not for the faint of heart. It is difficult not to spend when the market is soaring, and everyone else is chasing rigs and roughnecks, or to avoid laying off half your employees when cash flow plummets, because you think the market will recover shortly. Anyone who lived through 1979 or 1986 knows that sometimes what looks like a short-term peak or trough can really be a new, medium-term plateau.
The 1998 price collapse and subsequent recovery should prove to be relatively unusual events. The combination of an OPEC market-share war, occurring just at the start of the Asian economic collapse, caused unusually severe demand and supply shifts virtually simultaneously, resulting in a large inventory build. But future markets show every sign of being more volatile than those in the past, and the more prepared the industry is, the better it will survive the microbursts or local price spikes, the peaks and troughs of exacerbated cycles, and the political and policy response that is likely to follow.
References
- Lynch, Michael C., "Structural Changes in World Oil Markets and Their Impact on Market Behavior," MIT Energy Laboratory working paper MIT-EL 86-009WP, March 1986.
- Lynch, Michael C., "The Impact of Future Oil Price Paths on Oil Market Vulnerability to Supply Disruptions," in papers and proceedings of the Eighth Annual North American Conference, International Association of Energy Economists, November 1986.
- "Just as was the case in Texas, though, the amount of surplus shown is probably overstated. In 1967, when Texas was called upon to increase production after the first Arab oil embargo, the 4.0 million b/d surplus capacity that was nominally available proved to be very nominal indeed, as only 1.1 million b/d proved to be available. As stated in [Oil & Gas Journal] OGJ, Aug. 14, 1967, p. 67). 'Now the failure of many fields, particularly in Texas, to make their new high allowables makes it clear that the published estimates were far from 'instant capacity.' Perhaps the fullellipseextra capacity could be attained in a few months with additional field work and equipment" (Schurr, Sam H. and Homan, Paul T., "Middle Eastern Oil and the Western World: Prospects and Problems," Elsevier Publishing Co., 1971, p. 39).
- There always remains a problem with capacity numbers (and not just in OPEC), partly because of the greater difficulty in maintaining high utilization levels in some regions. The US, for example, has greater access to parts and engineering than many OPEC countries, and so the lower-capacity utilization figures in Africa do not necessarily mean available capacity.
- Littlejohn, W.L., "Will there always be too many refineries?" IAEE Newsletter, 2000.
- A number of past cycles of increased differentials followed by overbuilding, which collapsed margins, are described in Lynch, Michael C., "Shoulder Against Shoulder: The Evolution of Oil Industry Strategy," Journal of Energy and Development, Vol. 19, No. 1, 1995.
- This issue used to be studied comprehensively by the National Petroleum Council (Petroleum Inventories and Storage Capacity), but the latest publication was June 1984. At that time, NPC estimated that the need for operating inventories had declined by 60 million bbl during 1979-83, which was equal to 8%-about the same as the decline in refinery capacity. Compared with a decline in demand of 17%, however, it suggests that inventory efficiency had not improved greatly.
The author

Michael C. Lynch is vice-president, global oil, at WEFA Inc. He spent 20 years as a researcher at Massachusetts Institute of Technology. Most recently, he served as executive director of the Asian energy and security group at the Center for International Studies, where he wrote extensively on oil markets, forecasting, and energy security issues. He has numerous publications to his credit and has served as president of the US Association for Energy Economics.