Western Canada fiscal regimes analyzed for relative competitiveness
The Western Canadian Sedimentary basin (WSCB) is a large oil and gas-producing region that covers parts of several provinces.
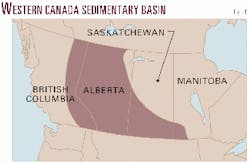
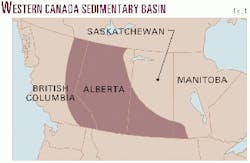
The basin blankets much of Alberta, extends into eastern British Columbia and southern Northwest Territories, covers much of the southern half of Saskatch- ewan, and reaches into southwestern Manitoba (Fig. 1).
In Canada, the provinces typically own the mineral resources encompassed within their boundaries and as such take a royalty share of the production of oil and gas. The provinces and territories have separate fiscal regimes, however, that provide for very different tax and royalty structures.
As a result, producers developing reserves in similar geological formations could experience different economic results depending upon which province contains the reserves in question. Indeed, the pace of development of such reserves could be fairly uneven if the fiscal regime in one province renders development economic at the same time that another province's regime generates uneconomic returns.
The purpose of this study is to compare the fiscal and royalty regimes of the four western Canadian provinces in order to examine their relative competitiveness from the standpoint of producers. The study looks at these fiscal regimes as they pertain to current discoveries, i.e. Third Tier heavy oil, Third Tier nonheavy oil, and Third Tier (or new) natural gas.
With respect to heavy and nonheavy oil, Third Tier refers to reserves discovered after May 1998 in British Columbia, September 1992 in Alberta, 1993 in Saskatchewan, and April 1999 in Manitoba.
With respect to natural gas, Third Tier in Saskatchewan refers to reserves discovered after February 1998. Alberta does not currently have a Third Tier royalty regime for natural gas. All gas wells drilled after 1973 are subject to the "New Gas" royalty structure.
For British Columbia, the royalty rates studied are for Non-Conservation gas production from wells on Land Rights acquired between June 1, 1998, and Dec. 31, 2000. Manitoba has a single royalty regime for natural gas irrespective of the discovery date.
By examining Third Tier royalties we attempt to assess the relative competitiveness of the various fiscal regimes as they effect full-cycle costs faced by the industry associated with bringing reserves into production. While the fiscal regimes in each province are multifaceted, the study proposes to compare competitiveness using a single measure namely, the price that provides a specific rate of return to producers on a well after taxes and royalties.
Each province has various incentives or royalty holidays in place that can be triggered by many different circumstances, for example, well location, well depth, well productivity. This article examines only the basic royalty structures for each province and therefore does not include any incentives or royalty holidays that a well might be eligible to receive.
Provincial tax structures
In the four western provinces, the calculation of taxable income is similar in that it is revenue net of operating costs, certain capital cost allowances, interest expenses, and provincial royalties.
Capital Cost Allowances include Canadian Exploration Expense (CEE), Canadian Development Expense (CDE), Canadian Oil and Gas Property Expense (COGPE), and other capital cost allowances (e.g., class 41). Some provinces also allow the greater of the provincial royalty and the Federal Resource Allowance as a deduction for income tax purposes.
The provincial tax rates in effect, however, are different.
The basic corporate tax rate is 16.5% in British Columbia and 17% in Saskatchewan and Manitoba. In Alberta, the provincial government has announced that the current tax rate of 15.5% will be reduced to 13.5% in April 2001 and then to 11.5% in 2002, 10% in 2003, and 8% in 2004. Thus, in terms of provincial corporate tax rates, Alberta will be increasing the competitive advantage it currently holds over the other provinces.
Provincial royalties
Each of the four western provinces has a royalty structure in place under which, as a result of the application of certain formulae, the province takes a percentage of either gross revenues resulting from the sale of a well's production or a percentage of actual volumes produced.1 2
Some similarities exist between the regimes in that in some cases the royalty formulae are sensitive to price or well production or both. Significant differences also exist in the respective formulae, particularly in the degree of price and volume sensitivity.
In the case of natural gas, Alberta, British Columbia, and Saskatchewan provide allowances to producers to compensate them for the cost of processing the provinces' royalty share of production. In Alberta allowances are provided to royalty clients that own gathering, compression, and processing facilities.
A cost of service is derived as a basis to calculate the government's share of costs.
For royalty clients that pay for gas gathering, compression, or processing on a fee for service basis in Alberta, the government pays its royalty share of fees that are charged. In British Columbia gas producers are eligible for the producer cost of service allowance (PCOS) for processing and gathering which is specified on a plant-specific basis.
In Saskatchewan, producers receive a deemed gas cost allowance of $10/thousand cu m.
The Manitoba royalty regime does not provide producers with any gas processing allowance.
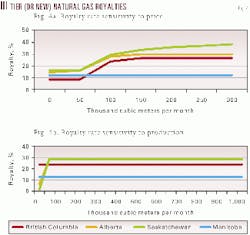
Although the royalty formulae employed are fairly complex, royalty rates under certain price and volume assumptions can be compared graphically in order to make observations with respect to each of the royalty regimes.
For each of Third Tier heavy oil, Third Tier nonheavy oil, and Third Tier (or New) gas, two graphs have been prepared, one showing the relationship between the royalty percentage levied and price and the other showing the relationship between the royalty percentage and well production.
For the graphs comparing royalty percent and price, well production per month are fixed at 1,028 thousand cu m (36,300 Mmbtu) for gas, 243 cu m (1,529 bbl) for heavy oil, and 365 cu m (2,297 bbl) for nonheavy oil.
For the graphs comparing royalty percent and production, prices are fixed at $93.075/thousand cu m ($2.63/Mmbtu) for gas and $125.86/cu m ($20 per bbl) for both heavy and nonheavy oil.
In all graphs, the Saskatchewan royalty rate shown is net of that province's 2.5% Resource Credit.
Heavy oil
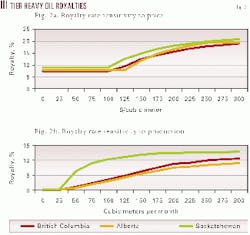
The graphs contained in Fig. 2 show that in Alberta, Saskatchewan, and British Columbia the royalty rate is sensitive to both prices and volumes. Manitoba does not have a royalty for heavy oil.
With respect to price (Fig. 2A), the Saskatchewan royalty is the highest throughout the entire range of prices shown. At prices below $100/cu m ($15.89/bbl), the British Columbia royalty rate is marginally lower than the Alberta rate. Beyond this price level this ranking changes on more than one occasion as the royalty curves intersect more than once. Fig. 2B shows that at $125/cu m ($20/bbl), the Alberta heavy oil royalty is the lowest at all levels of well production.
Nonheavy oil
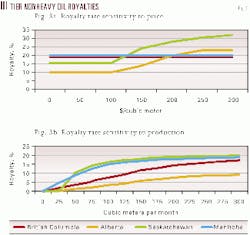
Whereas the nonheavy oil royalty regimes in Alberta and Saskatchewan are sensitive to both well production and price, the regimes in British Columbia and Manitoba are sensitive to well production only.
With respect to price (Fig. 3A), at lower price levels Alberta has the lowest royalty rate and Saskatchewan has the second lowest.
These two provincial royalty rates are sensitive to price, however, and this order changes at higher prices with Saskatchewan losing its competitiveness to British Columbia and Manitoba at around $125/cu m and Alberta losing its competitive edge at around $200/cu m ($31.20/bbl).
Saskatchewan's royalty rate is significantly higher than the rate in all the other provinces at prices higher than $150/cu m ($23.80/bbl).
In terms of its sensitivity to volume, Alberta yields the lowest royalty rate at every level of production at a price of $125/cu m.
While Saskatchewan's royalty rate is comparable to Alberta's at very low production levels its royalty rate rises quite sharply with well production, so that at a production rate of 50 cu m/month (314 bbl) Saskatchewan has the highest royalty rate among the four provinces.
British Columbia's royalty rate is lower than Manitoba's royalty rate at all levels of well production.
Natural gas
The graphs in Fig. 4 reveal that in Alberta, Saskatchewan, and British Columbia, the gas royalty is sensitive to price and insensitive to well production. In Manitoba the gas royalty percent is a flat 12.5% regardless of the level of price or volume.
At all levels of price and volume, Saskatchewan has the highest royalty rate. The gap between Saskatchewan and the other provinces widens at higher prices. Alberta has the next highest royalty rate followed by British Columbia. Although Manitoba's gas royalty rate is significantly lower than those of the other provinces, gas production there is negligible.
Overall competitiveness
This study proposes to compare the relative competitiveness of the four provinces using a single measure, namely, the price that provides a specific rate of return to producers on a single well on a stand-alone basis, after taxes and royalties have been paid.
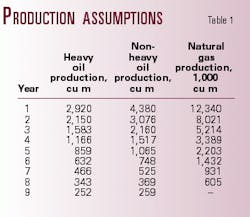
For each of heavy oil, nonheavy oil, and natural gas, a level of production for a typical well was used and the same level of capital costs and operating costs for each province was assumed. These production levels are shown in Table 1.3
With respect to capital costs, for both heavy and nonheavy oil the analysis assumes land costs of $20,000, exploration costs of $550,000, and development costs of $100,000. The same levels of costs are assumed for natural gas with the exception of exploration costs, which are assumed to be $850,000.
Operating costs are assumed to be an aggregate of fixed costs and those that vary with the level of production. For heavy and nonheavy oil a fixed cost of $20,000/year and a variable cost of $2/bbl were assumed. For natural gas a fixed cost of $20,000/year and a variable cost of 42¢/gigajoule (40¢/MMbtu) has been assumed. In all three cases, both fixed and variable costs have been assumed to escalate at a rate of 1.5%/year.
It is important to note that the level of costs used is illustrative only, and the rates of return that result are not meant to be indicative of actual returns realized by producers in the WCSB.
With respect to calculating gas cost allowances, the Alberta processing cost of 42¢/gigajoule (40¢/MMbtu) escalated at a rate of 1.5%/year was assumed to be a proxy for third party custom processing fees that are eligible for Gas Cost Allowance in that province.
For British Columbia a production weighted average of plant-specific Producer Cost of Service Allowances was calculated and also escalated by 1.5%/year. In Saskatchewan a deemed gas cost allowance of $10/thousand cu m (28¢/Mmbtu) was used. Where the royalty calculation involves the periodic establishment by the provincial government of a "select" price, the most recent select prices in effect were utilized and escalated at an annual rate of 1.5%.
In order to derive a target rate of return for producers in each of the provinces, the analysis commenced with an examination of returns to producers in the province of Alberta using the above production and cost assumptions. Alberta was chosen as the benchmark as it accounts for about 80% of oil and gas production in western Canada.
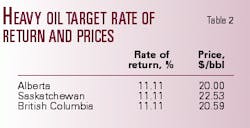
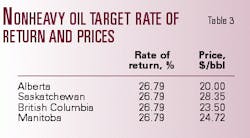
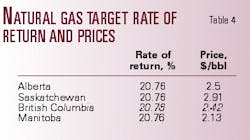
To calculate a target rate of return, prices of $125.86/cu m (or $20/bbl) were used for both heavy and nonheavy oil production and a price of $93.075/thousand cu m ($2.50/gigajoule or $2.38/Mmbtu) was used for natural gas production. The return to Alberta producers using these prices was then used as the target rate of return for the other three provinces and the prices required to achieve this target rate of return were derived. The results obtained from this analysis are summarized in Tables 2, 3, and 4.
Results
Heavy oil. Of the three provinces examined, Alberta has the most competitive royalty and fiscal regime as both Saskatch- ewan and British Columbia require prices higher than $20/bbl in order to generate the same after-tax return.
Saskatchewan is the least competitive of the three provinces.
Nonheavy oil. Table 3 shows that in the case of nonheavy oil, Alberta again has the most competitive royalty and fiscal regime. The other three western provinces require a price greater than $20/bbl in order to generate the same after-tax return.
The results show that Saskatchewan's fiscal and royalty regime is particularly noncompetitive as it requires a price some $8/bbl more than that required in Alberta and nearly $4/bbl more than that required in British Columbia and Manitoba to provide producers with the same economic return.
Natural gas. Alberta fails to retain its competitive advantage, however, with respect to natural gas. Table 4 shows that both British Columbia and Manitoba require prices less than $2.50/gigajoule in order to generate the same after-tax return as in Alberta. Once again, however, Saskatchewan has the least competitive fiscal and royalty structure of the four western provinces.
What has been learned
This analysis confirms that the different fiscal/royalty regimes in place in each of the provinces can have an important impact on the relative economics associated with oil and gas development in western Canada.
It is not surprising to discover that the Alberta royalty and fiscal regime fared well in this analysis, particularly in terms of heavy and nonheavy oil production, given the significantly lower provincial corporate tax rates in effect.
However, it is interesting that despite this significant corporate tax advantage, British Columbia and Manitoba would appear to be more competitive as to gas even though Manitoba produces little gas, and British Columbia might generally have higher gas processing costs due to the typically higher sulfur content of its gas.
Saskatchewan proved to have the least competitive basic royalty and tax structures of all the provinces for each of the commodities examined. Perhaps this is not surprising given its high corporate tax rate and oil and gas royalty formulae that are highly sensitive to production and prices.
Given the relative uncompetitiveness of Saskatchewan's basic royalty regime, coupled with the fact that producers have limited access to capital, Saskatchewan might have to rely heavily on providing royalty incentives if the province hopes to see its fair share of future oil and gas development.
In conclusion it is important to emphasize that this study assumed equal cost structures in the provinces and only examined provincial corporate taxes and royalty structures. The study did not include other provincial taxes such as capital taxes and sales taxes.
urther, British Columbia, Saskatch- ewan, and Manitoba have provincial sales taxes while Alberta does not. If the absence of sales tax in Alberta helps to lower capital and operating costs in that province then the competitive position of this province will be enhanced.
References
- "Oil and gas fiscal regimes of the western Canadian provinces and territories," Alberta Resource Development, August 1999.
- "Information Letter F99-17," Resource Revenue Branch, British Columbia Ministry of Energy and Mines, August 1999.
- "Canadian energy supply and demand to 2025," Table 5.4 and Fig. 7.2, National Energy Board, 1999.
The author
Mark Pinney has been manager of markets and transportation for the Canadian Association of Petroleum Producers for 5 years. His responsibilities include representing producer interests before Canadian and US regulatory bodies and conducting demand and supply analyses for the North American natural gas market. He has more than 10 years of industry experience. Pinney received a BS degree in economics from the University of Wales and an MA degree in economics from the University of Calgary in 1985. E-mail: [email protected]
