US demand growth in 2001 to respond to slowing economy
Demand for petroleum products in the US will increase again this year, stimulated by lower oil prices, closer to normal weather, and continued economic growth.
US crude oil production will not fall for the first time in a decade, though it is not expected to be above last year's output level. Imports will climb to meet demand. Stock levels will build slightly by the end of this year.
Demand for natural gas will move up, though high prices and low supplies will keep consumption growth below last year's rate.
The economy
Real gross domestic product (GDP) moved up last year an estimated 5%, compared with 1999 growth of 4.2%. Not since 1984 at 7.3% has GDP grown at such a rapid pace as in 2000.
OGJ expects this to be the eleventh consecutive year of economic growth in the US. The economic expansion will continue this year, but at a much slower rate of 2.1%.
Acting to calm the wave of what Federal Reserve Board chairman Alan Greenspan called "irrational exuberance" in the economy, the Fed raised interest rates five times between August 1999 and June 2000.
After its Dec. 19 meeting, the Federal Open Market Committee reported signs that economic growth is slowing include "the drag on demand and profits from rising energy costs." Other factors cited were sales and earnings shortfalls, eroding consumer confidence, and stress in some segments of the financial markets. The Fed recently lowered interest rates in an effort to re-stimulate the economy and ward off a recession.
Inflation will subside as the Consumer Price Index (CPI) increases more slowly this year, at 2.5%. Through the first 11 months of last year, the CPI rose at a 3.4% annual rate, up from 2.7% growth for the same period in 1999.
Housing starts are projected to fall in 2001 for the second year in a row, while sales of new cars and trucks are forecast to drop for the first time in recent years. The unemployment rate is expected to change only slightly, averaging 4.2% compared with 4.0% last year.
Total energy consumption
Growth in overall economic activity will boost total energy consumption again this year.
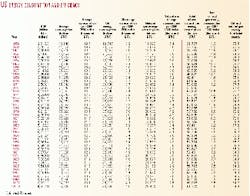
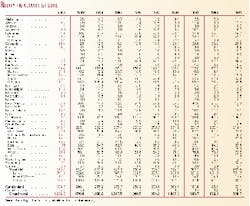
US energy demand has increased every year since 1990 when total domestic energy consumption was 81.32 quadrillion btu (quads). Last year demand totaled 94.1 quads, a 1.2% increase over 1999 consumption.
OGJ forecasts that total US energy demand will grow another 1.3% this year to 95.3 quads.
Last year's relatively high oil prices encouraged consumers to be more efficient with their use of energy. In 2000 the US economy consumed an estimated 10,100 btu/$ of real GDP, down from 10,500 btu/$ a year earlier.
In 2001 energy consumption is expected to fall again to 10,000 btu/$ of GDP.
Energy intensity, measured as energy consumption per constant dollar of GDP, has been declining since 1970. Since then, a greater percentage of the GDP has been contributed by the service, finance, insurance, and real estate sectors, and less so from the manufacturing sector.
The result of reduced energy intensity is that economic growth has become less sensitive to fluctuations of energy prices.
Energy by source
Consumption of all primary sources of energy except nuclear power will increase this year.
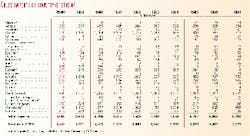
The biggest gainer will be natural gas, demand for which is expected to rise 2.4% to 23.45 quads. Last year gas consumption moved up 3%.
This year's energy from natural gas will set a record high level due to increased demand in the electric utility and industrial sectors, and because of near-normal winter weather. As the price of gas rises, however, utilities are upping their use of coal, nuclear, and hydroelectric power whenever possible.
Gas will continue to increase its prominence in the energy market this year, comprising 24.6% of the total. Last year gas accounted for 24.3% of the energy market, up from 23.9% the year before.
Oil energy consumption is forecast to move up slightly more than it did last year. OGJ projects that oil energy consumption will expand 0.8% to 38.32 quads. In 2000 consumption of oil increased only 0.1%.
Oil's share of the energy market will continue its recent descent, dropping to 40.2%, Last year, oil made up 40.4% of the market, down 40.8% in 1998 and 1999. In 1997, oil accounted for only 40.1% of the total energy market.
Oil and gas will dominate the energy market in 2001 with a combined share of 64.8%. This compares with a combined market share in both 1998 and 1999 of 64.7%. The combined market share for these two energy sources peaked in 1972 at 77.7%.
Coal energy consumption, primarily used for power generation, increased 1.1% last year, and is expected to rise this year another 2.2% to 22.28 quads.
Coal's share of the energy market will edge up to 23.4%. Consumption of coal will continue to increase in future years along with demand for electricity.
Net generation of electricity by utilities and nonutility power producers has been rising every year. Demand has especially been bolstered recently by increased power usage by computers.
For the first nine months of last year, total net generation was 2,885 billion kilowatt hours (kwh) compared with 2,819 billion kwh for the same period of 1999. A growing share of the total is coming from nonutility power producers as the industry moves away from regulated entities.
In 1999, the most recent year for which complete data are available, coal made up 56% of all fossil fuels used at electric utilities. For 2000, that figure is expected to fall, as there was an increase in the use of nuclear power.
Total consumption of nuclear power increased last year to 8.19 quads, up 5.9%, but is expected to dip 2.9% this year to 7.95 quads.
Nuclear power's share of the energy mix is projected to fall to 8.3% this year, down from the 2000 level of 8.7%.
The number of operable nuclear generating units has held steady at 104 since the last shutdown took place in July 1998. The number of operable nuclear power units peaked in 1990 at 112.
Capacity utilization of nuclear units has been the highest ever in the past couple of years. The average capacity utilization rate in 1997 was 71.1%, then in 1998 the rate jumped to 78.2%. For 1999 the average rate was 84.8%, and for the first nine months of last year, 86.8%.
Energy from hydroelectric power dropped more than 9% last year to 3.17 quads. Since the use of hydroelectric power is dependent upon precipitation, the decline was due to reduced amounts of rain and snowfall.
This year, OGJ projects, consumption of hydroelectric power will rebound more than 4% to 3.3 quads as a result of normal weather and precipitation. The hydro share of the energy market will be nearly unchanged at 3.5%.
Oil supply
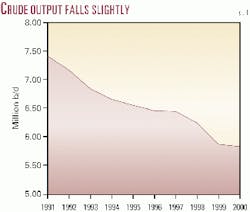
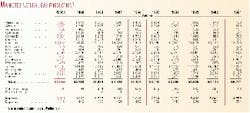
OGJ estimates that 5.84 million b/d of crude and condensate were produced in the US last year. This is a 40,000 b/d drop in production from the previous year.
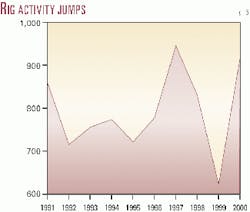
Higher oil prices spurred drilling, as reflected in the Baker Hughes Inc. rig count. For 2000, the rig count averaged 918 vs. an average 625 rigs-a modern low-in 1999 and 843 rigs in 1998. Despite the recent increase in activity, production is still limited by the past two years' restricted capital spending budgets that were the result of belt-tightening in an environment of the low oil prices that were posted in 1998 and 1999. Prior to that recent crash of oil prices the 1997 rig count averaged 943.
The average rig count will move higher this year as a result of the increased cash flow generated by last year's higher prices.
Last year the number of rigs in the Gulf of Mexico (GOM) jumped to 136 from 105 in 1999 and 121 in 1998. Of last year's GOM total, an average 117 rigs were drilling for gas, up from 80 the year before. There will be an increase in gas well drilling again this year.
Production of natural gas liquids (NGL) will increase this year, though not as much as it did last year. NGL output rose 5.1% last year compared with this year's expected gain of 0.9% to average 2.36 million b/d.
NGL output averaged 1.55 million b/d in 1989 and has been rising ever since. Increases in NGL production are tied to increases in production of gas, deeper extraction, and rising prices for the products derived from NGL such as propane and butane.
OGJ projects year 2001 total US liquids production of 8.2 million b/d, up from 8.18 million b/d last year. The recent high point in US output was in 1985 at 10.6 million b/d.
Production in Alaska peaked in 1988 at 2.02 million b/d. That state's output continued its ongoing slide last year to an estimated 970,000 b/d, down 7.6% from 1.05 million b/d the year before. Production in 1999 fell 11% from 1998. Higher prices last year helped slow the decline rate.
Alaskan output is expected to average 960,000 b/d this year.
Lower 48 production picked up slightly last year from its 1999 slump, up to 4.87 million b/d from 4.83 million b/d. In 1998 lower 48 production averaged 5.08 million b/d compared with 1997 output of an average 5.16 million b/d.
Estimated 2000 output rates in the major Lower 48 producing states were Louisiana with 1.53 million b/d, up 17,000 b/d from the year before; Texas with 1.42 million b/d, up from 1.40 million b/d; California with 835,000 b/d, down 22,000 b/d; Oklahoma with 193,000 b/d, unchanged from 1999 production; New Mexico with 175,000 b/d, down 1,000 b/d; and Wyoming, also down 1,000 b/d at 166,000 b/d.
Lower 48 production this year will average 4.88 million b/d, down 32% from a recent high of 7.16 million b/d in 1984.
Extra supply was injected into the domestic market beginning last October following President Clinton's order that 30 million bbl be released from the Strategic Petroleum Reserve (SPR). The goal of this unusual move was to avert a possible heating oil supply shortage this winter.
Twenty-three of the 30 million bbl were required to be in the marketplace by the end of November. The companies acquiring the crude agreed to return a total of more than 31.5 million bbl to the reserve by the end of this year.
SPR stocks finished 2000 at an estimated 545 million bbl, down from 567 million bbl at the end of 1999. OGJ projects that at the end of 2001 the SPR will contain 565 million bbl.
Stocks
Industry stocks at year-end 2000 were estimated at 926 million bbl, the total unchanged from year-end 1999. There was an underlying shift, however, as inventories of oil grew 7 million bbl and stocks of products declined by the same number.
When stocks stood at 941 million bbl at year-end 1996, that total was believed to be approaching the minimum operating level. Oil companies have grown more comfortable operating with stocks below the old base.
OGJ projects that by the end of this year total industry stocks will gain 27 million bbl. Crude oil stocks, excluding SPR, will end the year at 300 million bbl and product stocks will finish 2001 at 653 million bbl.
Imports
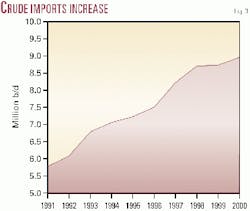
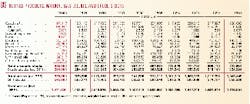
US imports are estimated to have averaged a record high 11.07 million b/d last year, up from 10.85 million b/d the year before. All of the gain was in crude oil imports, up 2.6%. Imports of products moved slightly lower.
Crude and products imports are projected to average 11.32 million b/d this year. Of this total, 9.2 million b/d will be imports of oil. Product imports will return to their 1999 level of 2.1 million b/d.
The US imports most of its oil and products from Saudi Arabia, followed by Mexico, Canada, and Venezuela.
It is estimated that an average 10,000 b/d were imported for the SPR last year, up from 8,000 b/d a year earlier, and none for the years 1995 through 1998.
Refining
Though crude runs are growing, capacity creep is suppressing refinery utilization rates.
Total input at refineries increased 1.5% last year, and so did operable capacity, resulting in a small drop in the utilization rate to 92.6%. Crude oil runs increased to 15.08 million b/d, up 1.9%. Total operable capacity ended the year at 16.5 million b/d.
Crude runs are projected to move up this year to average 15.25 million b/d. Total inputs to stills will increase 0.3% to average 15.35 million b/d. Capacity is expected to grow 0.5% to 16.6 million b/d, lowering the utilization rate minimally to 92.5%.
Refining margins, prices
The Chicago WTI refining margin last year averaged $5.55/bbl, according to Pace Consultants Inc. The lowest monthly average occurred in January at $3.06/bbl, and the high was recorded in June at $12.08/bbl when retail prices of motor gasoline exceeded $2/gallon in the Chicago area and in Wisconsin. Refiners were able to take advantage of a temporary regional shortage of gasoline that was caused by hitches in the supply chain. For July the Chicago margin fell back to an average of $3.33/bbl.
The Pace Chicago WTI refining margin for 1999 averaged $2.48/bbl.
On the Gulf Coast, the Pace refining margin for Arabian Light last year averaged $6.21/bbl, up from the 1999 average of $3.14/bbl.
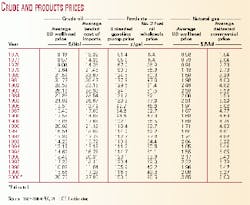
The estimated average US wellhead price of crude oil bounced last year to $27.23/bbl from $15.56/bbl in 1999 and $10.87/bbl in 1998.
The average landed cost of oil imports also jumped last year, to an estimated $26.84/bbl from a 1999 average of $16.47/bbl.
The average refiners' wholesale price of finished motor gasoline moved up sharply for the first nine months of last year to 95.7¢/gal compared with 60.5¢/gal for the same period in 1999.
The average pump price for unleaded gasoline was the highest ever for 2000 at an estimated $1.51/gal, up from $1.17/gal a year prior.
The average price in 1998 stood at $1.06/gal, down from 1997's $1.23/gal. In fact, the 1998 price is the lowest for unleaded gasoline since 1989 when the price averaged $1.02/gal and then moved up in 1990 to $1.12/gal.
Total gasoline taxes at the pump increased again last year, averaging 41.3¢/gal. Gasoline taxes in 1994 averaged 37.5¢/gal, jumped in 1995 to 39.3¢/gal, then in 1996 to 39.6¢/gal, in 1998 to 39.9¢/gal, and again in 1999 to 40.1¢/gal.
Last summer, after gasoline prices had reached their seasonal, though unusual, highs and were beginning to retreat, there was a proposal in the US Senate to suspend the 18.4¢/gal federal gasoline tax for 150 days in order to provide relief to consumers. The proposal was rejected.
The wholesale price of No. 2 fuel oil nearly doubled last year, averaging an estimated 88.3¢/gal, up from 49.3¢/gal. The price had been weak since averaging 63.9¢/gal in 1996 and fell in 1998 to 42.2¢/gal, its lowest level since 1978.
Oil demand
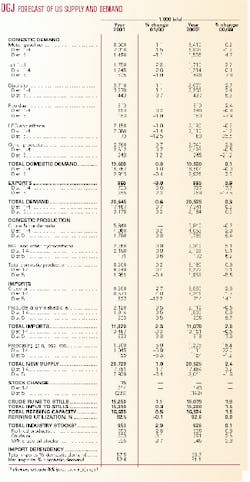
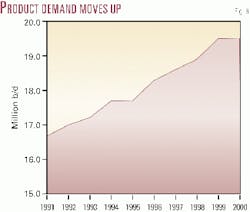
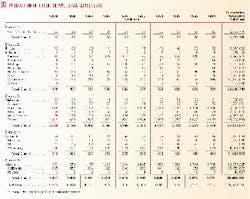
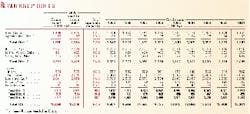
Consumption of most oil products will move up this year. OGJ projects that total US oil demand plus exports will be 20.6 million b/d.
Last year consumption plus exports totaled 20.5 million b/d. High prices limited US oil product demand growth, and consumption of some products decreased from 1999.
Exports of oil and products are expected to drop 3% this year to 965 million b/d. Exports were up 5.9% last year.
Oil-energy consumption has been rising while the amount of oil energy consumed per dollar of GDP - energy efficiency - has been declining. Oil-energy intensity is projected to fall to 4,000 btu/$ this year from 4,100 btu/$ last year and 4,300 btu/$ in 1999.
Motor gasoline
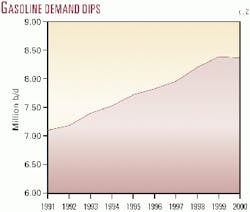
It appears that price elasticity curtailed demand for motor gasoline last year. Demand was only off 0.2% from a year earlier, but the trend has been in the opposite direction for the past few years. The last time demand for motor gasoline in the US fell was in 1991.
Moderating oil prices will increase demand for motor gasoline this year by 1.1% to set a record high of 8.5 million b/d.
The number of vehicle miles traveled is expected to show little change, though. Since 1973 the number of miles driven per vehicle has been climbing, but preliminary figures for 1999 suggest that mileage declined 119 miles per vehicle for passenger cars, vans, pickup trucks, and sport utility vehicles. Also, preliminary US Department of Transportation data show that in 1999 the fuel rate, or miles per gallon, for passenger cars fell for the first time since 1993. Fuel efficiency for vans, pickup trucks, and SUVs has been falling since 1993.
Decreased fuel efficiency will counteract any decline in miles traveled this year. The lower fuel rate combined with lower prices will boost demand for motor gasoline.
Jet Fuel
Demand for jet fuel will increase in 2001 for the 10th consecutive year. A continued increase in economic activity will boost jet fuel demand to a record 1.75 million b/d.
The latest Federal Aviation Administration data indicate that air carrier traffic, as measured by passenger enplanements, for the first quarter of last year vs. the same period in 1999 moved up 3.9%.
Jet fuel consumption increased steadily from 1 million b/d in 1981 to 1.5 million b/d in 1990, then dropped for two years as the economy weathered a recession and the military cut consumption. Average consumption in 1992 was 1.45 million b/d. As the economy began to expand again, so did demand for jet fuel. By 1997 jet fuel demand moved up to 1.6 million b/d, and last year demand averaged 1.7 million b/d.
Distillate fuel
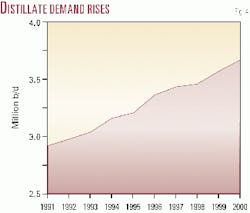
Demand for distillate fuel oil is expected to increase 1.1% this year to 3.71 million b/d. Demand has been climbing in step with transportation and the prosperous economy since 1992 when distillate fuel oil demand totaled 3 million b/d. Last year distillate demand was 3.67 million b/d, up 2.7%.
Normal winter weather will help to push up demand by increasing consumption of home heating oil. President Clinton established a home heating oil reserve in the northeastern US last July to be activated by Congress in the event that there is a supply emergency. This reserve offered a 2 million bbl supply cushion at the start of the heating season.
Residual fuel oil
OGJ expects demand for residual fuel oil to be unchanged from last year at an average 810 million b/d.
Demand for resid peaked in 1977 at 3.1 million b/d and fell each subsequent year until 1998 when falling oil prices helped it bounce back 11% from a year earlier to 887 million b/d. Average demand for resid in 1999 was 830 million b/d.
At 1.03 million b/d, October demand for resid was the highest monthly average since July 1998. This appears to be a temporary spike, as the following month's average fell back to 768 million b/d. High prices for competing natural gas amid normal winter weather boost demand for resid.
Other petroleum products
Demand for liquid petroleum gas (LPG) and ethane is forecast to fall this year 1.8% to 2.15 million b/d. This follows a dip in 2000 of 0.2%.
LPG and ethane demand peaked in 1999 at 2.195 million b/d. The most recent low point for LPG demand was in 1986 at an average of 1.5 million b/d.
Demand for all other products as a group, including lube oils and asphalt, is projected to increase 0.7% to 2.76 million b/d. Demand for these other products dropped last year 2.8%.
The "other product" category typically fluctuates in sync with the general economy. Increases in demand for petrochemical feedstocks, transportation, and construction result in increases to demand for these other products. Demand for other products hit a high in 1999 at 2.82 million b/d.
Natural gas
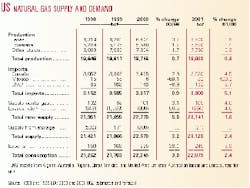
Total US natural gas consumption will increase 2.4% this year to 22.7 tcf. Since hitting a recent low of 16.2 tcf in 1986, consumption of natural gas has been slowly rebuilding to levels last seen in the early 1970s.
Increased use by electric utilities should be the main force behind the boost in demand. The US is experiencing winter weather that is closer to normal than has been the case in the past couple of years. Abnormally warm winters suppressed natural gas consumption in 1998 and 1999.
Very warm weather late in the summer increased demand for gas and curtailed injections to storage, giving rise to well-deserved supply fears. EIA estimates that the amount of working gas in storage at the end of November was 21% lower than a year earlier.
The combination of historically-low storage levels and a cold winter are currently keeping prices soaring. Higher prices in turn encouraged fuel-switching, especially by electric utilities. As the price of NYMEX gas at times exceeded $9/MMbtu, utilities last year increased their use of coal, nuclear power, and in more recent months, oil.
EIA figures show that through September electric utilities actually decreased their use of natural gas as an input in 2000, compared with a year earlier. Continued high prices should encourage more use of coal this year.
Residential use of gas was unchanged from 1999, but commercial and industrial customers increased demand for gas last year.
US production of marketed natural gas will increase this year to 19.9 tcf. Production has remained flat over the past few years, and actually dipped in 1999. The Gulf of Mexico is the only expected growth area for gas production. Higher prices encourage drilling, but production decline rates are increasing.
Imports from Canada continue to rise as more pipeline capacity is brought on line. Last year saw the start of production and imports from the Sable Offshore Energy Project via the Maritimes & Northeast Pipeline. The Alliance pipeline began shipping gas from Canada into the Chicago area last month.
In 1999, imports of gas from Mexico reached an all-time high of 55 bcf, then sputtered to a halt last April. Demand for gas in Mexico grew about 8-10% while production was flat, leaving no excess to export to the US, according to the Office of Fossil Energy. OGJ expects imports of gas from Mexico to pick up again and total 30 bcf this year.
Imports of LNG will move up this year to 150 bcf from 146 bcf. The US currently imports LNG from Algeria, Australia, Nigeria, Qatar, Trinidad & Tobago, and the United Arab Emirates.
OGJ estimates that 21 bcf of gas consumed this year will come from storage.
Prices of natural gas reached unprecedented levels last year, and the market shows no signs that they will pull back much soon. The January 2000 Henry Hub spot price averaged $2.40/MMbtu, then climbed each month except July. The December average was $9.02/MMbtu.
The average US wellhead price of natural gas last year was $3.85/MMcf. The NYMEX futures price averaged $4.20/MMbtu.
This year's average NYMEX futures price is expected to increase to $6.50/MMbtu.


