US petroleum industry stresses easing as downstream woes persist
Although the US oil industry has been under severe stress during the past few years, the sources of that stress have changed dramatically. In 1998 through early 1999, the industry suffered from extremely depressed prices.
The ensuing financial problems encouraged cutbacks in investment and employment, as well as an unprecedented level of industry mergers. Last year, however, the stresses were very different, as tight world oil supplies and low inventories of oil-and in the US, low natural gas storage as well-in the face of strong demand combined to produce sharply higher prices.
As a result of regulatory and logistical problems, certain regions witnessed price spikes well in excess of overall higher price levels.1
Of course, higher prices for crude oil and natural gas, as well as higher product margins, produced substantial gains in upstream and downstream profitability last year. Just as depressed prices forced cutbacks in 1998-99, high prices are now encouraging efforts to raise current and future levels of production and to ease any downstream bottlenecks in the supply of products to the market.
Upstream, the high price incentives appear to be working, but the downstream segment remains far more problematic.
This article reviews different aspects of the industry response to market developments of the past year.
At the global level, the supply situation has eased considerably. Although the most immediate factor has been higher production from the Organization of Petroleum Exporting Countries, a strong, worldwide recovery in drilling activity is under way, which supports longer-term relief.2
The US recovery, although oriented toward natural gas, has been especially strong, particularly in its early stages.
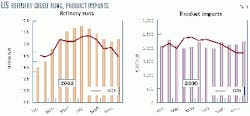
On the other hand, US refinery runs rose only modestly last year, while product imports were flat. US imports of gasoline were down significantly despite clear market signals for more supply.
There is no sign of any significant upturn in refinery investment because of the regulatory environment and understandable industry caution in a sector infamous for its low returns.
Land use and air quality concerns discourage the building of new refineries or the significant expansion of old ones in many parts of the country. In addition, product quality regulations continue to create barriers to the free movement of product and thereby continue to leave local markets vulnerable to disruption.
Employment, ROI
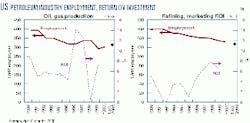
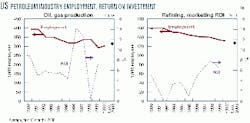
Fig. 1 illustrates trends in US petroleum industry employment and returns on investment for both upstream and downstream segments of the industry. Industry employment trends, as published by the Bureau of Labor Statistics, are shown for 1990-2000 (first 11 months' average for 2000) and for the latest month available (November 2000).
ROI averages are for the Financial Reporting System (FRS) companies, and they extend only through 1999.
The panel on the left shows trends for crude oil and natural gas production. Employment in 2000 was about 100,000 less than in 1990, but more than in 1999. The figure for the latest month, November, indicates employment is still moving up.
The FRS companies' rate of return on investment shows significant fluctuation since 1990 but with a clear, near-zero low point in 1998.
ROI moved back up in 1999 and, although the figure for 2000 is unavailable, the sharp increase in net income reported by major companies in the first 9 months, up 172%, indicates ROIs will be much higher than in 1999.
Employment in refining has fallen steadily since 1990 and, unlike the upstream segment, the decline is continuing. Generally, downstream companies have shown much lower ROI (in refining and marketing combined) than upstream, although 1998-99 showed the highest returns over the course of the 1990s.3
Net income figures for the first 9 months of last year for major companies were up 88% vs. 1999 figures. While the reported return on downstream investment should be up substantially in 2000, the gain is not having the same positive effects on employment as in the upstream.
Global drilling activity
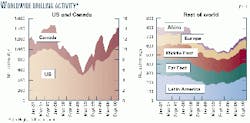
Drilling activity provides a clear indication of the upstream industry response to changing market conditions. Fig. 2 summarizes worldwide monthly activity since the beginning of 1997, as indicated by the Baker Hughes Inc. drilling rig count.
The left panel shows activity in the US and Canada, while the right panel shows activity in the rest of the world. In the US and Canada, low prices caused an immediate, sharp fall-off in drilling.
From a level of nearly 1,500 rigs in early 1998, the count fell to a low point of fewer than 600 in April-May 1999. As of November 2000, however, the total was up over 1,400.
In the early months of recovery, the gains were strongest for gas drilling. But, as of November, the number of US oil drilling rigs was up 61% vs. the year earlier (234 vs. 145 rigs), while the number of gas rigs was up 31% (832 vs. 635 rigs).
The extremely tight natural gas supplies and exceptionally high gas prices this past year have been pushing interruptible and spot market customers into the oil market for alternative supply. Therefore, an improvement in gas supply would help take pressure off of oil markets, especially the market for distillate (and particularly for heating oil in the Northeast).
There has already been a small increase in oil production in the Lower 48 after declines in 1998-99. There also has been a rise in US gas production as a result of the increased drilling activity. Further gains, especially in natural gas, are anticipated for next year.4 The decline was less steep elsewhere in the world, but recovery came much later-not until the spring of 2000, nearly a year after the turning point in the US and Canada.
Moreover, activity as of November was still below early 1998 levels. Part of the lag reflects the market perspective of major OPEC producers.
Although oil prices began to move up as early as March 1999, OPEC (apart from Iraq) maintained its production cutbacks until March 2000. Without the prospect of increased production and sales, the incentives for increased drilling efforts were clearly limited, despite higher prices.
Refining margins
The downstream segment has also received strong, favorable market signals this past year, but the response has been far more problematic.
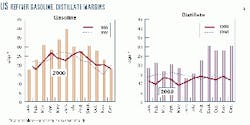
Fig. 3 gives another indicator of the recent gains for the US refining sector-the trends in refiner gasoline and distillate margins since 1998.
As shown in the left panel, gasoline margins last year, especially in the spring and early summer, were significantly higher than in the prior 2 years, although at yearend, they were more or less in line with earlier levels.
The gains for distillate-shown on the right in Fig. 3-have been even stronger, with what appeared to be a significant increase last February dwarfed by far larger increases beginning in August that have continued into the new year.
The persistent high margins since August are linked to distillate's role as a key substitute for natural gas for interruptible and spot gas customers.
With natural gas storage levels at extremely low levels and with spot gas prices soaring, these customers are being pushed into the distillate market. The low level of distillate inventories, especially in the US Northeast, is also helping to sustain high prices and margins.
Higher product margins
The downstream sector was receiving clear signals that their product was needed and that it would be unusually profitable to meet that need.
Nonetheless, the supply response has been somewhat muted. Fig. 4 shows recent trends in refinery runs and product imports. As shown in the left panel, crude runs by US refiners were up 2% last year vs. 1999.
On a monthly basis, after a slow start, runs moved above 1999 levels in May and have remained higher each month thereafter. While the average utilization rate last year was 91%, it was not exceptional.5 The average was the same as in 1999 and below the 95% average rates for 1997-98.
Last year, product imports to the US, in aggregate, showed no growth at all, despite the strong market signals for more supply. Throughout the spring and summer, imports were running significantly below year-earlier levels.
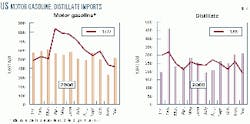
To focus on the reasons for the limited supply response, Fig. 5 shows trends in US imports of two specific products, motor gasoline and distillate. Motor gasoline includes both the finished product and blending components.
Imports of motor gasoline last year were 11% below the 1999 level. The differences were greatest in the late spring and early summer, just the period when market signals for more supply were strongest.
The timing of the import shortfalls corresponds almost exactly with the introduction last year of Phase II reformulated gasoline (RFG) in the US.
In effect, the US product specifications for RFG surpassed the ability of non-US suppliers to furnish product for the market. The new requirements, especially production of ethanol-based RFG for the Midwest, also limited the ability of refiners in the US to meet demand.6
Overall, US production of finished gasoline in 2000 was up less than 1% vs. 1999.
On the other hand, distillate imports showed a strong response to market signals. Overall, distillate imports were up last year by 6% vs. 1999.
The monthly patterns indicate even more clearly the supply response to market conditions. In February, when distillate prices, especially in the Northeast, were particularly strong, imports were up nearly 50% from year-earlier levels.
In November and December, imports of distillate appeared to be running at nearly 30% above year-earlier levels. US production of distillate also responded strongly, up about 51/2% last year vs. 1999, and up by 9% since August.
Unlike gasoline, distillate product specifications were not changed last year. The industry therefore faced no new production problems for this product and remained free to shop the world market for needed supplies.
Market Balkanization
So far, the downstream discussion has focused on US national developments. But last year, another aspect of downstream problems became exceptionally visible, the "Balkanization" of the national market for particular products, especially for gasoline where distinct "boutique" markets have been created (OGJ, July 17, 2000, p. 20).
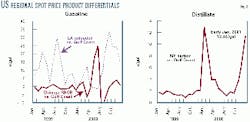
The left panel of Fig. 6 illustrates the point with respect to two notorious markets, California and Chicago. It shows the average monthly spot price differentials for:
- Los Angeles CARB (California Air Resources Board) unleaded.
- Chicago RBOB (reformulated gasoline blendstock for oxygenate blending used with ethanol in a ratio of about 90:10) vs. Gulf Coast reformulated gasoline.
California has long been known for its unique gasoline specifications and tight refinery balances, which together leave the market extremely sensitive to any disruption in local supply. Accordingly, spot price differentials for Los Angeles CARB unleaded vs. Gulf Coast have been exceedingly volatile, ranging from near zero to over 30¢/gal over the past 2 years.
Last June, Chicago (and Milwaukee) looked like California, as a spike in the spot price of RBOB pushed the average monthly differential vs. Gulf Coast reformulated to 25 from about 0.
Refiners had great difficulty meeting Phase II specifications for ethanol-based RFG-used almost exclusively in Chicago and Milwaukee. The resulting supply shortfalls, although small (about 2-3%), resulted in sharp increases in prices to consumers, as would be expected when the product involved is a virtual necessity.
After the television cameras went away, and calls for investigations of "gouging" died down, the specifications were quietly relaxed, helping to bring supply shortfalls to an end.
Distillate is not immune from regional market segmentation, either, but the causes are P I different. The right panel of Fig. 6 shows monthly average differentials between the spot price of No. 2 oil in New York Harbor and the price on the Gulf Coast. Note that the scale for the distillate differentials is about one-third the scale for gasoline.
Over the course of 1999, the differential averaged less than 2¢/gal.
But in January last year, the differential averaged 13¢/gal. At that time, a severe, prolonged period of cold weather raised normal residential consumer demand for heating oil, while limits on gas deliverability pushed interruptible and spot gas customers toward the Northeast distillate market.
Inventories were quickly drawn down to extremely low levels. With a lag, new supplies reached the market, primarily, as shown earlier, through a substantial increase in imports.
Late last year, the differential moved up again, averaging nearly 12¢/gal in December, although, so far, daily levels remain well below those extreme values reached last winter. Indeed, the daily differentials narrowed to below 4¢/gal at the beginning of this year.
Regional inventories remain very low, even allowing for the 2 million bbl in the newly created Northeast Heating Oil Reserve. With pipelines full, the marginal sources of supply are imports and waterborne shipments from the Gulf Coast.
But international tanker rates are high, a result of the surge in OPEC production-and thus international oil movements-while US Jones Act tanker capacity is also limited.
Thus some significant differential is likely to persist until it is clear that heating season needs are met and shipments to the Northeast recede.
Risks remain
Looking ahead, it's clear that upstream stresses are easing. In the US, production of oil, and especially natural gas, is increasing. Internationally, the OPEC focus has shifted from expanding production to managing a potential oversupply.
Downstream conditions, however, are different. High prices for natural gas and low storage are combining to prop up distillate demand and margins-conditions that are likely to persist until winter demands have been met.
In the case of gasoline, presumably refiners have managed to learn from last year's experience, while the quiet adjustments made to the reformulated specifications ease the risks of a new Midwest price spike.
But the problems and risks of "boutique" fuels remain. Indeed, there are new challenges to downstream companies that could aggravate risks-in particular, the new regulations for ultralow-sulfur diesel and the coming phase-out of methyl tertiary butyl ether.
Unless carefully-and flexibly-managed, the result could be new US supply shortfalls and new limits on the industry's ability to shop world markets to overcome them.
References
- To a certain extent, the tight supply situation last year was the result of actions taken to cope with earlier depressed prices, including the series of OPEC production cuts that began in early 1999 and were not reversed until March of last year.
- Until the Iraqi cutbacks that began in December 2000, OPEC production was up about 3 million b/d from its March 2000 level. The cutbacks came after the United Nations rejected Iraq's demand that buyers pay a 50¢/bbl surcharge directly to Iraq.
- The sample of FRS companies was modified in 1998 to include large independent refiners. In 1998, the newcomers had about 8% higher refined product margins than the incumbents. Their inclusion may have led to a small upward shift in reported returns on investment.
- The US Department of Energy's December 2000 Short Term Energy Outlook estimates Lower 48 crude production for 2000 at 4.87 million b/d, up slightly from 4.83 million b/d in 1999. Total US dry gas production for 2000 is estimated at 18.79 tcf, up slightly from 18.66 tcf in 1999.
- Utilization rates are calculated as crude runs divided by published beginning-of-year crude distillation capacity.
- Production was also inhibited to a certain extent by the Unocal Corp. patent-infringement legal issues.
The author
Ronald B. Gold is a consulting senior adviser to PIRA Energy Group and a consulting vice-president of Petroleum Industry Research Foundation Inc. (PIRINC), New York. He retired from Exxon Corp. at yearend 1997, where he was company economist and manager of the Energy Outlook division for Exxon Co. International. Gold also has worked for the US Treasury Department, Office of Tax Analysis, and was an assistant professor of economics at Ohio State University. Gold has an undergraduate degree from Brooklyn College, City University of New York, and an MA and PhD in economics from Princeton University.
