Pipeline Report: New method helps operators assess line integrity
New methodology based on structural mechanics and probability theory helps pipeline operators assess and ensure the integrity of their onshore high-pressure pipelines.
This field-proven approach, called structural reliability analysis (SRA), goes beyond fit-for-purpose assessment.1-7 It uses the concept of Bayesian Updating to handle the uncertainties inherent in managing thousands of miles of underground pipelines as it quantifies the contribution of each safety measure to the prevention of failure.
The operator then sets an integrity level based on consideration of likely threats and consequences of failure. Using SRA, operators can achieve and show consistent levels of reliability and safety, even for non-piggable pipelines.
Moreover, by effectively allocating resources to control the risk on their systems, operators can ultimately reduce the cost of their total integrity-management program.
The challenge
Countless factors, working alone or in conjunction, affect the structural integrity of pipelines. Designers and operators employ several actions to assess integrity, prevent failure, and mitigate damage. These actions may be:
- Introduced at design, such as upgrading materials and increasing wall thicknesses.
- Performed during construction, such as carrying out weld checks, coating inspections, and hydrostatic pressure testing.
- Deployed during operation, such as conducting internal inspections with in-line inspection devices and making predictive assessments (a structured method of integrating data from external inspections with the physical attributes and operating history of the pipeline).
While each action contributes to the overall integrity and safety of a pipe line, quantifying the exact contribution that each action (or combination of actions) makes to the structural reliability of a pipeline presents a challenge.
SRA quantifies the relative contribution of each failure-mitigation activity. The technique combines theoretical and empirical structural mechanics with uncertainty analysis. While data play a vital role in any integrity-management program, operators without vast amounts of data find SRA easily accommodates uncertainties.
The method can be used to optimize the scheduling of in-line inspections and to establish confidence in the information obtained from predictive assessments.
Bayesian Updating derives from the work of 18th Century British mathematician Rev. Thomas Bayes who developed statistical theory and methods to address multiple uncertainties when solving theoretical and applied problems in science, industry, and government. The technique allows operators to combine different sets of information to improve or disprove a level of confidence.
SRA works for virtually any failure mechanism, including internal corrosion and ground movement. A typical example, based on several companies' information and presented later in this article, uses a pipeline subject to common external corrosion for purposes of study.
In particular, the example focuses on non-piggable pipelines because the Office of Pipeline Safety in the US Department of Transportation reported only about 37% of US pipelines were inspected by smart pigs in 2000.
For both piggable and non-piggable pipelines, SRA consists of six elements:
- Establishment of limit states.
- Identification of failure modes.
- Formulation of limit-state functions.
- Analysis of uncertainty.
- Evaluation of failure probability.
- Assessment of results.
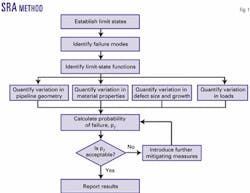
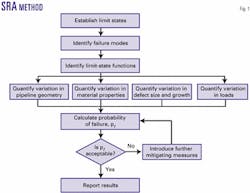
Fig. 1 shows the relationship between these items, and a brief description of each and the role it plays in the overall analysis follows.
- A limit state is the state of a structure at which it no longer satisfies a particular design requirement.
- A failure mode is a mechanism that leads to a structure reaching a limit state. If left undetected and unprotected, the corrosion failure mode will eventually lead to a breach of the pipeline wall, resulting in the ultimate limit state, loss of containment.
- A limit-state function is the relationship between relevant parameters characterizing the failure mode at the onset of failure. Such expressions are generally obtained through structural mechanics studies supported and validated by test data.
The limit-state function for corrosion defects relates the defect depth at failure to the defect length and hoop stress and is given by Equations 1-3 in the accompanying box of equations.
- The probability of failure will depend on the likelihood of any particular defect reaching a depth ac and on the number of defects that are likely to be present in the pipeline.
It is thus necessary to take account of the uncertainty in the number of defects present, the defect depth, and the critical defect depth, which depends on the uncertainty in wall thickness, hoop stress, ultimate tensile strength, and defect length.
It is important to note that the time dependency of the uncertainties in the number of defects, defect depth, and length must be taken into account.
In the case of non-piggable lines, it is necessary to quantify the uncertainties in these time-dependent quantities with other information, such as that obtained through close-interval survey (CIS), DC voltage gradient (DCVG) survey, and bell-hole excavations.
- In practice, the calculation of the probability of failure is complex, taking into account the uncertainties in the material and geometrical properties. To simplify the analysis, however, it is assumed here that all these quantities are known exactly.
The probability of failure, Pf, due to corrosion within time interval (0, t) is given by Equation 4, which gives an annual probability of failure, PFA (Equation 5) in which EN is the expected number of defects and it has been assumed that all defects are introduced at the same time.
It is a straightforward matter to modify these expressions to take account of a variable rate of introduction of defects as a function of time. The appropriately modified expressions for annual failure probability can be used to set inspection intervals.
The value of an acceptable failure probability depends on several issues, including the consequences of failure, societal attitudes, and costs of failure mitigation. Operators should not lay down a fixed value for failure probability, however, but rather consider the effect of both failure probability and its gradient.
As far as inspection interval scheduling, the most appropriate approach is to use the value that leads to minimum expected cost.
- Probabilistic analysis of integrated pipeline data can predict the future of a pipeline.
The objective of predictive assessment is to acquire an acceptable level of confidence in the structural integrity of the pipeline based on an appropriate consideration of the information obtained from indirect measurements, such as CIS, DC voltage gradient survey, and direct measurements from bell-hole excavations.
Example
The following typical example illustrates the application of the SRA approach in the assessment of the results. This example, based on information from several companies, shows the approach as used systematically to change the confidence in the expected number of corrosion defects based on information gathered from CIS, DCVG, and bell-hole excavations.
A method has also been given to the determine the structural reliability based on the renewed confidence in the number of defects and on the likelihood of any given defect failing within a specified time, taking corrosion growth into account.7
The example shows that this new method can integrate key data from a number of sources to demonstrate an adequate level of structural reliability without resorting to re-hydrostatic testing or in-line inspections.
Close-interval survey
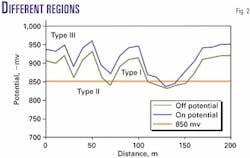
An indication of the number of corrosion defects can be found by prioritizing the CIS results into different types:
Type 1: "On" - "Off" potentials shifted in a positive direction, with both potentials more positive than -850 mv, indicate a probable defect.
Type 2: "On" - "Off" potentials shifted in a positive direction, with the "On" potential more negative than -850 mv and the "Off" potential more positive than -850 mv, indicate a possible defect.
Type 3: "On" - "Off" potentials shifted in a positive direction, with both potentials more negative than -850mv, indicate a possible defect.
Fig. 2 shows the different types.
It is important to note that the CIS output is only an indicator that corrosion is actually taking place when the reading is taken, and no indication is given of the extent or depth of such a defect. The CIS reading does not indicate the presence of defects that were not corroding at the time of the survey but had been corroding previously.
There is thus a probability, Pm , that a defect will be missed. It is customary to express this probability in the form Pm = 1 - PoD where PoD is known as the probability of detection.
Conversely, it is possible that for each of the region types mentioned there is no corrosion defect. It thus follows that there is a probability per unit length, Pf, of a false indication.
It is readily apparent from the previous calculation that the number of corrosion defects, NCIS, indicated by CIS in a length L of pipeline will generally differ from the actual number of defects present, NAC, which is, of course, unknown. The uncertainty in the value of NAC can be determined with probability theory.
The conditional probability p (NAC | NCIS) of the pipeline containing NAC defects given that the CIS indicates that there are NCIS defects present can be obtained using Bayes Theorem (Equation 6).
In this probability, p (NAC) denotes "initial" knowledge of the probability that the pipeline contains NAC defects before obtaining the CIS results.
The conditional probability p (NCIS |NAC) appearing in the right hand side of the previous expression can be deduced from a logical consideration of the combinations of missed defects, detected defects, and false indications that can result in NCIS defects being reported when NAC defects are actually present.
Such an analysis results in an expression having the functional dependence shown in Equation 7. This equation can be used in conjunction with Equation 8 in order to determine the change in the confidence in the number of corrosion defects based on the CIS data.
Equation 8 gives the expected number of defects following the CIS. Performing the associated calculation requires determining the values of Pf and PoD. Following is the method used for this purpose:
The approach adopted here to determine the effectiveness of the CIS system was to compare the CIS readings on a particular piggable pipeline with results from an in-line inspection of the same pipeline.
The analysis technique and results follow. For each type of region, a probability of detection, PoD, and a probability of false indication, Pf, is calculated as shown in Equation 9.
DCVG surveys
Once a CIS has been completed and the Type I, II, and III regions have been calculated, a DC voltage gradient survey, which is able to examine the size and the nature of the defect, can be carried out. This can either look at the whole pipeline or concentrate on the regions highlighted by the CIS results.
An analogous procedure to the previous description is used to determine the updated distribution of NAC, but in this case the previous distribution is taken as the posterior distribution following the CIS analysis.
Thus, introducing the shorthand notation pCIS (NAC) = p (NAC | NCIS), it is appropriate to determine the quantity p (NAC | NDCVG) using the expression shown in Equation 10.
The expected number of defects following the DCVG and using the information gathered from the CIS is given by Equation 11.
As is the case with the CIS, there will be a probability of detection and a probability of false indication. In order to perform the associated calculation, it is necessary to determine the values of Pf and PoD.
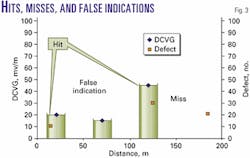
The calculation of the PoD involves finding out how many "hits" and "misses" there are, where a "hit" comes when a defect lies within Dx m either side of the DCVG indication. The calculation of Pf involves finding out how many times a DCVG indication is nowhere near a defect.Fig. 3 shows a schematic of the definition of a "hit," "miss," and a false indication.
Bell-hole excavations
If the calculated probability of failure cannot be considered acceptable, then further information must be acquired in addition to undertaking possible remedial work. Bell-hole excavations can be used for this purpose.
This involves uncovering short sections of pipeline at the locations considered most likely to contain a defect based on the indications of the CIS and DCVG. If defects are discovered that are severe enough to pose a threat to integrity in the future, then remedial action will be taken.
The effect of bell-hole excavations is multi-functional. The initial findings allow a further updating of the number of defects present to be performed. The measurements allow an updating of the distribution of defect depth to be performed. The repairs result in a reduction in the numbers of onerous defects.
Updating probability of false indication
The previous belief of the likelihood that a defect will be present in a Type I location is simply equal to 1 - Pf, where Pf is the probability of a false indication in a Type I area. This belief is naturally based on the assumption that the value of Pf is a true attribute of the CIS/DCVG system.
This is the only sensible belief that can be held without further information. Once further information is obtained from a number of excavations, however, it is possible and indeed necessary to challenge this belief.
It is thus appropriate to formulate the null hypothesis, H0, that Pf is a true attribute of the CIS/DCVG system and the alternative hypothesis; H1 that it is not.
The initial strategy to adopt will be to undertake M excavations in Type I locations. The expected number of defects will simply be M (1 - Pf). If the actual number of defects found, m, is greater than this quantity, then alternative hypothesis will be that Pf is less than the previous value and, conversely, if fewer defects are found, that it is greater than the previous value.
With Bayes Theorem to determine the probability, p (H0 | m), that H0 is true given m defects were found in M excavations, an updated value of the probability of false indication can be obtained with Equation 12.
A similar approach may be applied to Type II and Type III regions.
Updating probability of detection
In order to update the view held on the probability of detection, it is necessary to perform some excavations in regions that do not have any indications from the CIS. Note that the information obtained from these locations can only update the combined PoD from Types I, II, and III. It cannot directly update the view on the individual PoDs.
The previous belief of the likelihood that a defect will be present in a region with no indication of a defect is given by 1 - PoD, where PoD is the combined probability of detection by Types I, II, and III. This belief is naturally based on the assumption that the value of PoD is a true attribute of the CIS/DCVG system.
This is the only sensible belief that can be held without further information. Once further information is obtained from a number of excavations, however, it is possible and indeed necessary to challenge this belief.
It is thus appropriate to formulate the null hypothesis, H0, that PoD is a true attribute of the CIS/DCVG system and the alternative hypothesis, H1 that it is not.
The initial strategy to adopt will be to make M excavations in locations with no indication. The expected number of defects will simply be M (1 - PoD). If the actual number of defects found, m, is greater than this quantity, then the alternative hypothesis will be that PoD is less than the previous value and, conversely, if fewer defects are found, that it is greater than the previous value.
With Bayes Theorem to determine the probability, p (H0 | m), that H0 is true given m defects were found in M excavations, an updated value of the probability of detection can be obtained with Equation 13.
Updating defect size distribution
The measurements of defect size made at the sites of bell-hole excavations will allow an updating of the distribution p (a, T) to be undertaken, where T is the time of the excavation relative to some reference time. This can be achieved with Bayesian Updating techniques.
This test case, involving the application of the predictive assessment procedure to a 100-km pipeline, begins by assuming that Pf and PoD values have been established by correlating CIS and DCVG data with in-line inspection results from a "similar" piggable pipeline.
It is assumed that this correlation has resulted in Pf = 0.1 and PoD = 0.75 for the CIS system, and Pf = 0.05, PoD = 0.75 for the DCVG system.
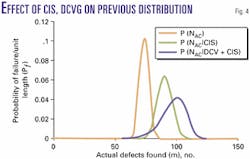
Based on considerations of the age of the pipeline and previous CIS, DCVG, and bell-hole excavations, it is considered that the previous distribution of the number of defects in the entire length of the, p (NAC) line is given by Equation 13, and this is shown as the solid curve in Fig. 4. The expected value of NAC is 98.
The CIS has indicated that there are 75 Type I, 105 Type II, and 200 Type III indications. For simplicity's sake, only the Type I indications are addressed here.
With the aforementioned method, the updated distribution p (NAC | NCIS) is shown by the short dotted line in Fig. 4. The expected number of defects is 91.
It is assumed that the DCVG is also applied to the entire length of the pipe and that this gives 60 indications.
The updated distribution P (NAC | NDCVG) is shown as the longer dotted line in Fig. 4. The expected number of defects once the CIS and DCVG are taken into account is 74.
In order to illustrate the effect of bell-hole excavations, suppose that 20 excavations are undertaken in Type I locations and that the confidence held in the null hypothesis regarding the probability of false indication is 90%.
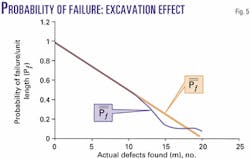
The expected number of defects that will be excavated in this case is 18, based on Pf = 0.1. The variation in P_f and P=f with m is shown in Fig. 5. It is seen from this diagram that the value of P=f does not differ significantly from Pf for values of m close to the expected value, that is, values in the range (16-19).
As m decreases to less than 16, however, the value of P=f begins to increase and approaches the estimated value P_f as m falls to less than 12; that is, for values of m to less than 12, the null hypothesis becomes insignificant and the updated belief is dominated by the observations.
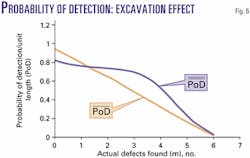
Suppose also that six excavations are made in locations for which there are no indications and again that there is 90% confidence in the null hypothesis that PoD = 0.9. In this case, the expected number of defects is 0.6 and the variation in P_oD and P=oD is shown in Fig. 6.
It can be seen that PwowDw is not significantly different from PoD for values of m less than or equal to 2 but begins to decrease as m increases greater than 2 and approaches the estimated value at m = 5; that is, the null hypothesis becomes insignificant and the updated belief is dominated by observations.
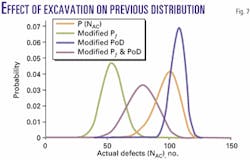
Fig. 7 illustrates the effect on a previous distribution of the updating that results from bell-hole excavations. It has been assumed that 20 excavations were made, with an expectation of finding 18 defects, but that only 10 were found. The probability of a false indication is thus, by reference to Fig. 5, modified to a value of 0.495.
Likewise, it was assumed that six excavations were made at locations that were not expected to contain any defects and that four defects were found. From Fig. 6, the probability of detection is thus modified to 0.528.
Fig. 7 shows how these excavations modify our view of the distribution of defects. The previous distribution is shown by a solid line, with an expected value of 98 defects. The result of digging at locations where defects were indicated, taken in isolation, is to increase Pf and reduce the expectation to 54 defects in 100 km.
Similarly, it can be seen that the digs at locations where no defects were indicated reduced PoD and, taken in isolation, increased the expectation to 107 defects. Applying the modified Pf and PoD together can be seen to broaden the posterior distribution of actual defect number and alter the expectation to 78 defects.
Acknowledgment
The authors thank several colleagues for useful contributions to this work, particularly Mike Gardiner, Andrew Goodfellow, Marcus McCallum, Gary Senior, and Bob Greenwood of Advantica Technologies Ltd., Loughborough, UK. The authors further thank Advantica Technologies Inc. for permission to publish this article.
References
- Francis, A., Edwards, A.M., Espiner, R.J., and Senior, G., "Applying Structural Reliability Methods to Ageing Pipelines", IMechE Conference on Ageing Pipelines, Newcastle, UK, Oct. 11-13, 1999.
- Francis, A, Edwards, A.M., and Espiner, R.J., "A Fundamental Consideration of the Deterioration Processes Affecting Offshore Pipelines using Structural Reliability Analysis," ETCE/OMAE 2000 Joint Conference, New Orleans, Feb. 14-17, 2000.
- Edwards, A.M., "The Application of Structural Reliability Analysis Towards Developing Pipeline Integrity Management Programs," AGA Operations Conference, May 7-9, 2000, Denver.
- Francis, A., Edwards, A.M., Espiner, R.J., and Senior, G., "An Assessment Procedure to Justify Operation of Gas Transmission Pipelines at Design Factors up to 0.8," Pipeline Technology Conference, Brugge, Belgium, May 21-24, 2000.
- Francis, A., Espiner, R.J., Edwards, A.M., and Hay, R.J., "A Consideration of Data Requirements for Structural Reliability Based Assessments of Onshore Pipelines," 5th International Conference on Engineering Structural Integrity Assessment, Churchill College, Cambridge, UK, Sept. 19-21, 2000.
- Francis, A., McCallum, M., Gardiner, M., and Michie, R., "A Fundamental Investigation of the Effects of The Hydrostatic Pressure Test on the Structural Integrity of Pipelines using Structural Reliability Analysis," 20th International Conference on Offshore Mechanics and Artic Engineering, Rio de Janeiro, June 3-8, 2001.
- Francis, A., Gardiner, M, Goodfellow, A., McCallum, M., Senior, G., and Greenwood, B., "A Systematic Risk and Reliability-Based Approach to Integrity Management of Piggable and Non-Piggable Pipelines," Pipeline Integrity & Safety Management Conference, Houston, Sept. 24-28, 2001.
The authors
Andrew Francis is manager of the structural safety solutions team at Advantica Technologies Inc., Longborough, UK. He holds BSc, C Eng, MIMechE degrees and a PhD in engineering mathematics from Southhampton University, is a chartered engineer in the UK, and in 1998 was named Engineer of the Year by the Institution of Gas Engineers, UK, for his contribution to high-pressure gas pipeline uprating using Structural Reliability Analysis.
Phil Geren serves as director of business development for Advantica Technologies Inc. He has held positions in research, plant operations, engineering and construction, law, business development, and general management. Previous employers include Enron Corp., Koch Industries Inc., Engelhard Corp., ABB Lummus Global, UOP LLC (AlliedSignal), and Haldor Topsoe, Inc. He holds a BS in chemical engineering from the Georgia Institute of Technology, Atlanta, and a JD from DePaul University College of Law.
Bruce Phillips serves as vice-president of Advantica Technologies Inc., the US division of Advantica Technologies Ltd. He joined Advantica with 26 years of experience in the energy industry, ranging from technical and operational posts through commercial and business development project stints. Previous titles include vice-president for Enron Clean Fuels for Enron Corp. and managing director of Koch Industries International for Koch Industries Inc. He holds a BSc (1975) in chemical engineering from the University of Texas and is a registered professional engineer in Texas.
Case study
The first large-scale application of SRA occurred in 1996, when BG Transco faced increasing demands for gas from both residential, commercial, and industrial customers of the UK national grid.
Transco estimated it would take about 3 years and $580 million to build more pipelines to handle anticipated capacity and smooth load peaks. Or, for around $72 million, Transco could raise the volume of gas moving through its Scottish feeder lines by 15% to achieve the same level of performance.
But to win regulator approval of the more cost-effective option, Transco would need to show safe operation at a design factor exceeding the UK design code, then set at 0.78. Transco and Advantica Technologies Inc. worked with regulators to develop a robust and transparent method to assess and demonstrate the safety of increasing the operating pressure from 1,015 psig (70 bar) to 1,232 psig.
After 18 months of testing that used SRA and quantified risk assessment, the companies proved that the uprating would not compromise the integrity of the system. The work further resulted in an amendment to the design code that allows the use of SRA to justify operation at design factors up to 0.8.
Beyond design challenges, SRA has been used to assess the structural integrity of underground pipelines and aboveground installations throughout the world, including several systems in the US.
