The petroleum industry stands at center stage amid issues over climate change and emissions of greenhouse gases (GHGs), while consumers worldwide expect the industry to provide inexpensive fuel for transportation, heat, and electricity.
This article examines the relationship between hydrocarbon fuels (natural gas, oil, and coal) and carbon dioxide emissions and how increasing concentrations of atmospheric CO2 correlates with global temperatures.
Hydrocarbon fuels dominate the energy mix. Natural gas, oil, and coal provided 88-89% of the total primary energy consumed in the US during the 1990s, 65% from oil and gas.1
Hydrocarbon fuels, of course, emit CO2 during combustion. Because energy demand generally increases in expanding economies, one would expect that, over time, CO2 would be released to the atmosphere in gradually increasing volumes. If CO2 emissions are to be reduced, the amount of energy produced from hydrocarbon fuels must be reduced proportionately.
The Kyoto Protocol, written in December 1997 by representatives from more than 160 governments, presents a dilemma. How does economic growth continue without discharging increasing volumes of CO2 into the atmosphere? The protocol would require developed nations to reduce GHG emissions by an average of 5.2% below 1990 levels by 2012. To comply, the US would have to reduce emissions 30-35% below projected levels for 2012. The similar projection for European Union nations would require a 15-20% reduction (OGJ, Jan. 19, 1998, p. 35).
Focus on CO2 emissions
A brief explanation shows why, among all human-generated GHGs, CO2 has become the focus of the climate-change issue.
Atmospheric scientists have estimated the warming effect of increased atmospheric concentration of each GHG, and CO2 emissions contribute by far the greatest warming effect, roughly 65% of all GHG emissions. Combustion of hydrocarbons accounts for more than 80% of CO2 emissions.2 Methane emissions contribute the next largest warming effect, 18%. Human sources of methane are split among industrial leakage, agriculture, sewage treatment, landfills, and biomass burning. Thus the finger points at CO2 and the combustion of hydrocarbons.
Hydrocarbon emissions
The stoichiometry of complete combustion of hydrocarbons tells us the ratio of energy produced through the oxidation of carbon vs. hydrogen.
Roughly half of the energy produced by burning natural gas derives from the oxidation of carbon, half from oxidation of hydrogen. About 60% of the energy produced from the combustion of liquid fuels comes from carbon; from coals, the ratio is 80-90%.
We can, then, at a glance see how fuel switching might reduce CO2 emissions. The most significant reductions could be realized by widespread conversion of electrical generation from coal to natural gas. But such proposals must be viewed with skepticism. Gas resources may not be able to support such a great increase in demand.
A smaller CO2 reduction might be possible by emphasizing the consumption of natural gas over liquid fuels. But the high energy densities of liquids uniquely suit them to be the ideal portable transportation fuel.
Widespread conversion of liquid fuel to gas in the transportation sector must, therefore, be regarded as infeasible, not to mention the capability of gas resources to absorb another major increase in demand.
Thus, any reduction of CO2 emissions through fuel switching will be heavily dependent upon the capability of gas resources to replace coal. The effect will necessarily be gradual and will be manifested only as a slight reduction in the growth rate of CO2 emissions during the time that coal-fired power plants are being phased out.
Renewables, efficiency
In mainstream news and on talk radio we commonly hear suggestions that CO2 emissions will be significantly reduced by conservation, expansion of renewable energy, and improved energy efficiency. Government at all levels reinforces these views with studies and funding.
These complex topics deserve thorough analysis as to their true potential to reduce CO2 emissions. Few specifics have been offered beyond superficial assurances that emerging technologies will provide greater energy efficiency and new energy sources.
Analysis of both renewable energy sources and energy efficiency will be presented in a later article by the author. But it is clear that most of the growth of non-hydrocarbon energy over the next 20-30 years will come in the form of electricity from hydro and nuclear sources.
CO2 and temperature
If atmospheric CO2 is linked with climate change, we should be able to see a correlation between global temperature data and atmospheric CO2 concentrations. Temperature is the only climate parameter, measurable with consistency and over a long enough time span, that can be compared with CO2 measurements.
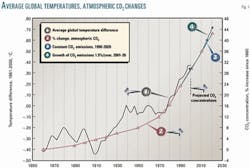
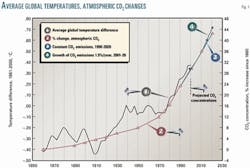
Fig.1 shows changes in both average global temperatures, and atmospheric CO2 during 1860-2000. The temperature plot shows an irregular trend that generally parallels the trend of increasing CO2.3
Air bubbles preserved in layers of the great ice caps in Greenland and Antarctica provide an accurate history of the composition of the atmosphere. Analysis of ice cores provides the proxy CO2 data prior to l958, when direct measurements atop Mauna Loa, Hawaii, began. Direct measurements match and overlap the ice-core data to make a consistent record.4
Constructing a consistent record of average global temperature by direct measurements, is, however, much more difficult. The average global temperature combines surface air temperatures on land with sea surface water temperatures.
Research groups around the world have selected locations on land where consistent observations have been recorded for a substantial portion of the 140-year period. Researchers corrected the temperatures of selected sites, where surroundings had become urbanized, by correlating temperatures to those recorded nearby that had not been so affected. In order to be statistically consistent with the final computed average, temperatures selected to be included in the average had been measured to the nearest 0.1° C.
Merchant seamen traditionally have recorded and reported air and sea surface temperatures as input for weather forecasts. Their method in decades past was to insert a thermometer into a bucket of water drawn from the sea. More recently, seawater temperatures have been recorded at the intake to the engine cooling system.
In order to resolve the slight differences in temperature caused by the differing procedures, researchers measured those temperature differences and adjusted the record accordingly. More than 60 million temperature observations have been averaged into the historical record represented by Fig. 1.
Since 1979, orbiting satellites have recorded temperatures and other parameters at various levels of the atmosphere. While the record of data collected by satellite is too short to demonstrate a distinct trend of average global temperature, comparative plots of data collected since 1979 by satellite, weather balloons, and surface air temperatures all track each other with minor deviations. It appears, therefore, that any of the three methods of temperature measurement is capable of providing a representative record of average global temperature.5 6
In examining Fig, 1, no clear correlation between changes to atmospheric CO2 concentrations and average global temperatures had begun to emerge until after 1930. By the early l940s, temperatures rose 0.2° C. above previous highs, accompanied by a 6.6% increase in CO2 since 1860. If scientists had compiled global temperatures at that time, some of them might have been concerned by the trend.
Over the next 35 years, however, average global temperatures stabilized or even cooled slightly while increases in CO2 concentrations began to accelerate. During the early 20th Century, CO2 increased by only 3 ppm/decade. But decadal increases were 4, 4, 7, and 13 ppm during the 1940s, 1950s, 1960s, and 1970s, respectively.
If increasing CO2 causes warming, what factors might have led to the slight cooling trend during the mid-20th Century? Aside from the simple expectation that any trend toward higher temperatures would never be uniform, some investigators have offered an explanation.
The mid-20th Century was notable for its lack of controls on air pollution. Chemicals and particulates, upon which moisture coalesces, increase the reflectivity of the atmosphere, thus returning more of the sun's radiation to outer space. These moisture particles, called aerosols, are known to have a cooling effect on the lower atmosphere.7
During the 1970s and 1980s, industrial nations, e.g., North America and Western Europe, embarked on pollution-abatement programs. Chemical and particulate emissions and the resultant aerosols were reduced, thereby reducing the reflectivity of the atmosphere. More solar radiation reached the earth's surface, where it was partially trapped by increasing atmospheric CO2.
The second period of warming during 1980-2000 seems to confirm the foregoing interpretation. Average global temperatures increased 0.4° C during 1975-2000, roughly the same warming observed during 1910-40. Meanwhile, CO2 concentrations continued to accelerate, with increases of 15 ppm in the 1980s and 20 ppm in the 1990s. So it seems that global temperatures, atmospheric CO2 concentrations, and pollution trends generally correlate with each other.
The correlation between CO2 buildup and global temperatures will be confirmed if the temperature trend continues upward over the next 5-10 years, even at a rate less than that observed during 1980-2000. The World Meteorological Organization updates the trend of average global temperatures annually and posts it on their website.3
Some scientists have attempted to correlate global temperatures with variable characteristics of the sun, such as total solar irradiance and sunspot cycles. Correlations are obscure, however, and are statistically linked rather than causal.8 9
Compared with global temperatures, the future trend of atmospheric CO2 concentrations is almost set in stone. Combustion of hydrocarbons is not likely to decrease over the next 20 years and more likely will increase slightly. CO2, therefore, will be emitted at no less than the rate of the 1990s when concentrations gained 20 ppm. Data compiled thus far for 2001 shows that CO2 will average around 372 ppm, continuing the annual gain of 2 ppm measured during the 1990s. That means the atmosphere will carry at least 390 ppm by 2010, and 410 ppm by 2020.
The National Oceanic and Atmospheric Administration posts up-to-the-hour readings of CO2 concentrations as measured atop Mauna Loa, Hawaii.10
Observed warming has amounted to 0.8° C. during the 20th Century, about half of it since 1980. In similar fashion, CO2 concentrations grew linearly during 1890-1940 and then accelerated. Two-thirds of the total increase since 1860 has come since 1960. As much CO2 will be added to the atmosphere during 2000-20 as was added during 1900-80. The concentration of CO2 that is certain to be present in the atmosphere by 2020 is also plotted on Fig. 1, showing that the potential for future warming is considerable. If the CO2 buildup has indeed caused warmer temperatures, we are now only beginning to see the temperature response.
The response time of warming from atmospheric CO2 buildup is unknown. The temperature record gives us few clues as to when changes have or might be manifested by CO2 that was emitted during the 1980s or 1990s. No one can guess how long earth's atmosphere will take to equilibrate to CO2 added during 2000-20. Such is the reasoning behind the metaphor that humankind is conducting a gigantic experiment with the atmosphere. We do not know where it is taking us.
Climate modeling,feedback mechanisms
In an effort to see where that experiment is taking us, the Intergovernmental Panel on Climate Change (IPCC) has compiled results from research aimed at determining how the earth's climate system might respond to concentrations of atmospheric CO2 that are now increasing at rates 150 times faster than at any time in the last 100,000 years. Increasing temperature is only one such response.
With warmer temperatures on land and at sea, more water vapor will enter the atmosphere. Water vapor is also a GHG and further adds to overall warming, a positive feedback. But with more water vapor come more clouds, precipitation, and storminess, as well as greater reflectivity of the atmosphere. Some warming effect will, therefore, be countered by increased reflection of solar radiation.
Snow and glaciers also contribute to earth's reflectivity. Glaciers retreat under warmer temperatures, decreasing the reflectivity. More solar radiation then reaches the surface, another positive feedback.
Ocean currents, driven not only by winds but also by variations in water temperature and salinity, play a critical role in the transfer of heat from equatorial regions toward high latitudes. Deep ocean currents, termed thermohaline circulation, may have the most profound effect on climate of any feedback mechanism (see article, p. 22).
Some earth scientists have described thermohaline circulation not merely as a feedback but as an independent climate amplifier. W.S. Broecker, a leading authority, has identified millennial oscillations of the thermohaline circulation as the primary driver of the glacial-interglacial climate oscillations during the last 100,000 years.
Climate scientists continue to refine their predictions of climate change by developing increasingly complex mathematical models of earth's climate system, and quantifying the myriad feedback responses. Science is, however, only beginning to understand the complex systems that drive the thermohaline circulation.
Future climate changes
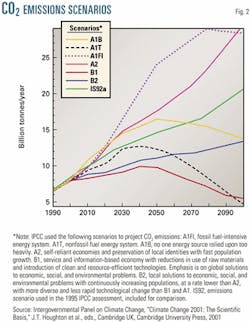
In order to develop a range of possible climate changes, IPCC has defined a series of scenarios for future CO2 emissions and has run each scenario on several climate models (Fig. 2).11
IPCC's projections for temperature increases by 2100 are 1.3-5.6° C., depending on the scenario for CO2 emissions and the differences in the way each climate model handles input data and feedback mechanisms. IPCC's projected increase in sea level is 13-80 cm.
The warmer end of the temperature range is based on scenarios of steadily increasing rates of CO2 emissions throughout the 21st Century. By contrast, scenarios with CO2 emissions peaking in midcentury show a warming increment of 1.3-3.3° C.
In Fig. 2, IPCC's scenario with the least CO2 emissions, B1, predictably shows the smallest temperature increase: 1.3-2.5° C. by 2100. IPCC defines B1 as "a service and information-based economy with reductions in the use of raw materials and introduction of clean and resource-efficient technologies, with the emphasis on global solutions to economic, social, and environmental problems."
Under B1, CO2 emissions would reach a high plateau during 2035-50-about 18-19% higher than in 2000-then would tail off about 45% by 2100. By then, CO2 emissions would be 22% below 1990 emissions.
IPCC describes A1T, the other scenario with lower CO2 emissions in 2100 than for 1990, as "a nonfossil fuel energy system." But A1T shows CO2 emissions increasing steadily to a plateau 50-54% higher during 2030-50 than in 2000. Emissions decline to the 1990 level by 2085 and continue to decline about 35% below 1990 by 2100. The projected temperature increase under A1T is 1.7- 3.3° C.
The irony here is that B1 and A1T are the only scenarios to show lower CO2 emissions in 2100 than in 1990. Both scenarios show emissions sliding back to the 1990 level by 2080-85, not by 2012 as called for by the Kyoto Protocol. With its scenarios, IPCC tacitly acknowledges that targets for CO2 emissions under the protocol are unachievable.
IPCC estimates that the rise in sea level during 1990-2100 would be 13-50 cm under the B1 scenario and 17-60 cm under A1T. The wide range measures the level of uncertainty among the climate models.
Limited resources
In defining scenarios, IPCC evidently assumes that hydrocarbon resources will be capable of delivering increasing volumes of fuel to market indefinitely. Assessing resource capability for 100 years, however, is another daunting project. The petroleum industry has historically succeeded in developing oil and gas resources to supply growing markets with fuel. But how long will the industry be able to continue to increase supplies of oil and gas by 1-2%/year?
B1 and A1T are the only scenarios to reflect limitations of hydrocarbon resources, but both show continued heavy use of hydrocarbons through mid-century. B1 shows CO2 emissions gaining about 0.5%/year until 2040, and then holding a plateau until 2050. In A1T's "nonfossil fuel energy system," emissions increase 1.5% annually through 2030, then hold that level until 2050. IPCC could eliminate all other scenarios as being implausible, thereby reducing uncertainties of their temperature and sea level projections.
B1 and A1T outline general limits within which the world continues to utilize hydrocarbon energy.
The future
With atmospheric CO2 concentrations certain to rise by 2 ppm/year through 2020, the petroleum industry will feel increasing pressure to direct its expertise toward reducing the growth rate of global CO2 emissions. Pressure will intensify if, over the next few years, a continued upward trend of average global temperature confirms the correlation between CO2 and temperature shown in Fig. 1.
But mitigation measures are likely to have minimal effect or to be costly. Some will require heavy consumption of energy. The CO2 Capture Project, a joint study by nine majors, seeks cost-effective processes for capturing CO2 that would be either retrofitted or incorporated into new designs of electric power generators and refinery units (OGJ, July 9, 2001, p. 34).
Processes to scrub huge volumes of flue gases will consume energy and require massive quantities of absorbing chemicals. A cost-effective step might be to focus on new coal-fired power plants, where up to 90% of the electricity is generated by oxidizing carbon. After the usual pilot studies, scrubbers or other processes could be applied to flue gases, which would contain 6-8% CO2. Concentrating the points of capture to the largest sources would maximize the reduction of CO2 emissions and minimize costs. The obvious conclusion is that, if consumers around the world want to mitigate climate change, they must be willing to pay higher prices for energy.
References
- DeGolyer & MacNaughton, 20th Century Petroleum Statistics 2000, p. 110.
- Houghton, J., Global Warming-The Complete Briefing, 2nd edition, 1997, Cambridge University Press, Chapter 3.
- World Meteorological Association annual statement of the status of global climate: www.wmo.ch/web/ wcp/wcdmp/statement/html/statement.html
- Mackenzie, F., et al., "Recent Past and Future of the Global Carbon Cycle," Geological Perspectives of Global Climate Change (AAPG Studies in Geology No. 47), edited by Gerhard, L., et al., 2001, p. 57.
- Houghton, J., op. cit., pp. 46-48.
- Discussion with Trenberth, K., National Center for Atmospheric Research, Boulder, Colo.
- Trenberth, K., "Stronger Evidence of Human Influence on Climate-The 2001 Assessment," Environment-Where Science and Policy Meet, Heldref Publications, Washington DC, May 2001, p. 13.
- Foukal, P., "The Variable Sun," Scientific American, February 1990, p. 34.
- Haigh, J., "The Effect of Solar Variability on Climate," Science, May 17, 1996, p. 981.
- National Oceanic and Atmospheric Administration for atmospheric CO2 concentrations: www.cmdl.noaa. gov/. Click on Mauna Loa home page, then on "Live Data," then on "Carbon Cycle," and "Results " (text).
- IPCC, Climate Change 2001: The Scientific Basis, J.T. Houghton, et al., eds., Cambridge University Press, 2001, Cambridge, UK.
The author
Thomas H. Standing has worked in civil and chemical engineering disciplines, including refinery operations, chemical process design, and most recently, pipeline maintenance for the San Francisco Public Utilities Commission. Concurrently, he is analyzing trends in production and development of North American oil resources from publicly available data and assessing the potential energy contributions from renewable and alternative sources. Standing has a BS in chemical engineering from the University of Minnesota and is a registered civil engineer in California.
