Is ethylene approaching its lifecycle's maturity?
A scenario in which the ethylene lifecycle matures and enters decline within the next 30 years is plausible and is ignored in long-term planning at one's peril.
In such a scenario, the trend growth rates in the medium term will also start to drop. This analysis contrasts with the typical scenarios offered by consultants in which trend growth continues at rates comparable, or even higher, than those in the recent past (OGJ, Apr. 23, 2001, p. 58).
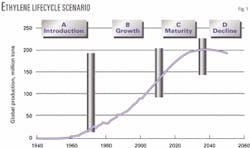
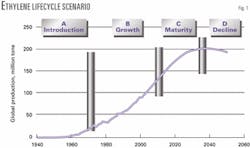
Fig. 1 illustrates a scenario in which global ethylene growth peaks by 2040. The graph assumes global gross domestic product (GDP) growth continues indefinitely at an average rate of slightly less than 3%/year. Ethylene growth drops to the GDP rate by 2015, continues to fall thereafter, reaching zero by 2035, and then goes negative.
This growth pattern results in a traditional lifecycle curve. Ethylene demand has historically reflected that of the petrochemical industry as a whole. Alternative routes to petrochemicals and plastics, however, may become economic in the coming decades.
Approaches
Our approach has been to assess scenarios by quantifying their implications and looking at the plausibility of the results from a variety of perspectives. Although in directional terms our base-case scenario projections have often been close to the actual course of events (for example, in terms cycle timing), this has perhaps been as much the result of luck as of judgment.
Quantification approach
The main aim of quantification has not been accurate prediction but rather to ensure consistency and rationality.1 More often than not, assumptions that are individually plausible are untenable when combined in sets.
Thus, for instance, projections of supply and demand need to be constrained within the bounds of reasonable profitability profiles via the "hockey-stick" correlations between price and expectations about the shortages of supply.2 3
The process of quantification can also provide valuable insights and better understanding of the impact of key factors and the plausibility of outcomes. Further, well-constructed and consistent scenarios have a better chance of having elements that match the course of events.
In the past, overoptimistic single-scenario demand projections have led to some major dislocations in the industry: for example, the overbuilding of the late 1970s and the painful rationalization in the 1980s.
Product-lifecycle approach
One useful approach for examining demand projections is the product lifecycle.
Products and industries themselves typically have finite lifetimes that consist of four stages: product introduction, growth, maturity, and decline. An S-shaped curve traditionally represents the lifecycle in linear terms (Fig. 1).
In the introduction stage, growth is substantially higher than that of the economy as a result of both substitution of existing products and new uses. By the end of the growth period, the substitution of competing products has leveled out, and new uses have tailed off so that growth rates match those of the economy.
In the maturity period, new products may substitute the given product, so that the latter sees a further decline in growth rate. The point at which the growth curve peaks (that is, growth drops to zero) is the start of the decline stage.
Attempts to use lifecycle analysis as a predictive tool have failed. The transition points are not clear-cut and not identifiable a priori from historical data or the shape of the curves, and rejuvenation can occur in the later stages. Looking at lifecycle curves together with various other criteria, however, can yield how plausible are scenarios that entail turning points.
Uncertainties in forecasting
There are a number of uncertainties associated with the historical demand projections of ethylene. Recognizing these makes scenarios in which the ethylene lifecycle matures and enters decline within the next 30 years (as in Fig. 1) quite plausible.
Extrapolations for forecasting
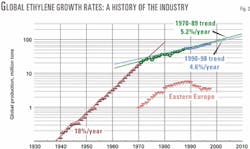
Fig. 2 shows the historical growth pattern for the global ethylene industry. The data are plotted in semilog format with straight lines representing constant rates of growth. The same data (plotted linearly) form the first part of Fig. 1, the lifecycle reference curve.
During extended periods (for example, the 30-year 1940-70 period), the data can readily be fitted with a single exponential regression trend line. Radical changes in the trend, however, can also take place (for example, the start of the 1970s). For the period after 1970, good fits can be made with either a single regression or by splitting the period in two (Fig. 2).
Simple statistical extrapolation has considerable appeal because it has the appearance of avoiding subjectivity. Unfortunately, because such extrapolation fails to anticipate turning points, it can also be dangerous.
Good statistical fits for past data (for example, correlation coefficient R2 > 0.9) can provide an unjustified sense of confidence about forward predictions. For the 1940-70 period, an 18%/year exponential growth curve for global ethylene shows a goodness of fit close to unity.
Projections for demand growth extrapolated from that well-established trend was a major cause for the excessive overbuilding in the late 1970s. Actual ethylene growth from the early 1970s onwards dropped to 5%/year and led to the severe restructuring in the industry in the 1980s.
Does the lower growth 1988-98 represent an inflection point or just a period below trend? The difference between the projections based on the 1971-88 and 1988-98 exponential "trend" lines is equivalent to more than 50 crackers by 2010.
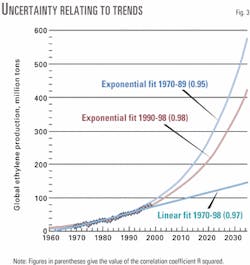
Power and linear growth algorithms also provide excellent fits for global ethylene growth. Unfortunately, these all give radically different results on projection (Fig. 3).
Therefore, at best, regressions are only good empirical fits over limited time segments.
GDP for forecasting
Industry analysts frequently suggest that tying growth rates to GDP can reduce the uncertainty of projecting product demand. The opposite is probably true, however, because making a link with GDP introduces an additional uncertain parameter, the GDP growth rate itself.
For developed economies, historical GDP data are relatively reliable, and the uncertainties relate primarily to projections. For the former Soviet bloc and the developing areas, however, substantial questions remain about the reliability or meaning of even historical data, and these affect global estimates.
In the past, different sources have come up with conflicting estimates for global GDP. In some cases (for example, economic forecasting company Wefa, analysts have made substantial ongoing revisions of the estimates over time.
Nonetheless, tying growth rates to GDP provides a good check and reference framework for absolute magnitudes and timing (relation to the overall business cycle). What it does not do is improve predictability in any absolute sense. In addition to the uncertainties related to estimating and projecting GDP growth, the relationships of product to GDP growth can also undergo step changes.
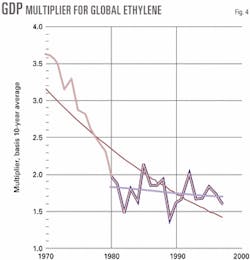
The relationships to GDP are typically considered in terms of "multipliers" and "penetration" curves. These parameters are tied to the life-cycle analysis, which anticipates that growth ultimately falls and declines to GDP growth levels or lower as a product matures.
Multipliers in this context are defined as the ratio of product growth rates to GDP growth rates. They can be useful for orientation purposes, but their use is often confounded by lack of consistency. For example, different values result from a 5-year running average, a 10-year running average, and a trend line.
In keeping with lifecycle theory, multipliers will also change radically and unpredictably. The multiplier (calculated using exponential trendline regressions) for the post-1970s growth for ethylene fell from about 4 to less than 2.
Fig. 4 shows the course of the multiplier from 1980 onwards based on a 10-year moving average. The likely causes for that sharp fall are a change in ethylene's lifecycle phase from an introduction to a growth stage in the 1960s, compounded by the oil price shocks of the 1970s.
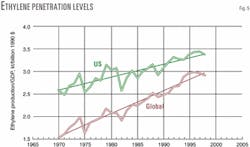
An alternative way to look at the relationships to GDP is in terms of penetration levels, which are typically quantified in terms of 1,000 tons production/GDP in constant dollar terms (Fig. 5).
As can be seen, however, ambiguity remains. Looking at such plots in the mid-1980s, for example, Exxon Corp. rationally but erroneously argued that the ethylene penetration for the US and Europe was complete and that ethylene demand would only grow in these economies at rates no higher rates than those for GDP.4
Signs of approaching maturity
In making growth projections, we have to make an assumption, explicit or implicit, about the lifecycle position of the product in the various markets. We also have to consider the possibility of discontinuities.
The key premise in developing the scenario in Fig. 1 is that the global ethylene industry is approaching maturity. Based on observations of trends, longer cycles of innovation, probabilities, and scenario parameters, such a scenario is plausible.
Analysis of trends
The analysis of trends suggests that global ethylene growth may have started to fall both in absolute terms and in relation to GDP. Namely, Exxon's projections in the 1980s were directionally correct but premature.
Note that falling global ethylene growth does not conflict with continued high growth of ethylene demand in China and the Asia Pacific, nor with revival of demand in the former Soviet Union (FSU) in the medium term.
Examination of the disaggregated regional trends shows that the extended and severe disruption to growth in the FSU is contributing to the flattening in the global growth curve and revival of growth here can be anticipated.
Longer-term cycles of innovation
The concept of longer-term cycles of innovation appears to have substantial weight, with the information technology or "high-tech" economy corresponding to the newest phase.5 The corollary is that petrochemicals, which comprise part of the earlier "industrial" phase initiated in the 1950s, are starting to approach maturity. The extent to which petrochemicals have become commodities subject to cycles tends to add weight to such a view.
There is, of course, a possibility that the new economy will boost, rather than supplant the older products like petrochemicals. Though history does not support such a precept, it does provide another plausible scenario.
Also, ethylene could cease to be a good surrogate for petrochemicals as a whole, which may become increasingly sourced, say, directly from natural gas. The lifecycles of the petrochemical industry and ethylene would then diverge.
Copernican probabilities
J. Richard Gott has developed a fascinating set of techniques, called the delta t argument, to estimate the range of remaining lifetimes of any entity based on the length of time for which that entity has been in existence.6 These are based on the Copernican principle that says we are unlikely to be exceptional and unlikely to live in exceptional times.
Accordingly, if the petrochemical industry started about 1940, then there is a 50% probability that the remaining lifetime of the industry is between 20 and 180 years.
One can argue that this range is so broad as to be meaningless. The calculation is instructive in the present context, however, because it confirms that scenarios in which global ethylene peaks within the not-so-distant future are within the bounds of reasonable probability and are, therefore, plausible.
Scenario parameters
To develop the life-cycle scenario quantified in Fig. 1, we assessed that a peak somewhere between 2030 and 2040 was plausible. We then iterated around this assumption examining what that would mean for sets of growth-rate patterns and per-capita consumptions for the various regions.
Honing in on comfortable numbers resulted in an estimate of global ethylene production of 200 million tons in 2035. Interestingly, this starts to approach the levels that a linear projection would yield.
For comparison, if ethylene continued to grow steadily at 4.6%/year (the lower bound of the recent historic exponential fits in Fig. 2), the demand in 2035 would be about double that in the peaking scenario, a difference equivalent to five large-scale plants/year during the period.
Under the assumption that the population increases at slightly lower rates than it does currently, in the peaking scenario, global per-capita consumption for 2035 would be 20 kg/year. For comparison, the current per-capita consumption in the US, Western Europe, and worldwide, respectively, are about 75, 50, and 14 kg/year.
In the peaking scenario, therefore, growth moderates to rates such that the per-capita consumption of ethylene in developing economies never reaches the levels currently prevailing in the developed ones.
In physical terms, a fall in the ethylene usage per unit of GDP, as a result of characteristics of the new economy (entailing much higher service and IT components) and the switch to different base feedstocks, will encourage the ultimate decrease in ethylene demand. A given living standard is therefore reached at significantly lower per-capita consumption of ethylene.
Features of the industry would likely include the increasing importance of natural gas and hydrogen as feedstock and energy sources and novel routes to polymers. Longer cycles in profitability as well as substantial short-term volatility would continue to present a challenge to the commodity chemicals industry.
Given the tendency towards optimism, substantial overbuilding for ethylene might be expected by the end of the present decade in this scenario.
The exodus of icons such as Monsanto Co., the ICI Group, and Hoechst AG from basic petrochemicals may represent not only search for improved profitability, but also belief in a scenario along the lines outlined here.
References
- Sedriks, W., "Petrochemical Industry Outlook," Scenario & Strategy Planning, October/November 1999, p. 10.
- Sedriks, W., "Petrochemical Industry Price Projection," Report No. 205A (October 1999), Process Economics Program of SRI International.
- Sedriks, W., "Understanding the Petrochemical Cycle," Hydrocarbon Processing, March 1994, p. 49.
- Robertson, K. N., "World Olefins Outlook," World Chemical Congress of Marketing and Business Research, Newport Beach, Calif., Sept. 10, 1986.
- "Survey on Innovation," The Economist, Feb. 20, 1999.
- Gott, R. J., Nature, May 27, 1993, pp. 315-319.
The author
Walter Sedriks recently founded Sedriks & Associates. He was formerly director of economic studies for the chemicals and energy practice at SRI International. His industry background includes more than 10 years with Shell Development Co. and Air Products (UK) in process development and evaluation, process design, and plant startup. He holds an undergraduate degree in chemical engineering from Imperial College, London, and a PhD in chemical engineering from Pembroke College, Cambridge. In addition, he studied business administration at the London School of Economics.
