US gasoline-marketing margins statistics begin in this issue
In the statistics section of this issue, Oil & Gas Journal introduces Muse, Stancil & Co.'s monthly gasoline-marketing margins. This series will provide insight into the relative profitability of the gasoline-marketing business in four major US metropolitan areas: Chicago, New York, Houston, and Los Angeles.
Muse is an international firm consulting in economic and strategic issues in the downstream energy industry. This article is the third in a series introducing profitability statistics in the downstream sector. In addition to marketing, Muse provides monthly profitability statistics for refining and gas processing.
This article outlines the channels of trade that exist in gasoline marketing and Muse's methodology for analyzing the gross margin contributions by business segment. Historical monthly margins starting in January 1997 are available through the Oil & Gas Journal Energy Database.
Value chain
With respect to gasoline and diesel sales, marketing is typically defined as the segment of the business that takes product from the refinery gate to the retail customer. Marketing provides the services and covers the costs of breaking the bulk shipments from a refinery into smaller sales, to the point of ultimate sale to the consumer at the retail pump.
Gasoline is supplied to the market from domestic refinery production as well as foreign imports. It is distributed from refineries by waterborne shipments or pipelines to terminals where the product is staged for transshipment into additional distribution pipelines or for delivery of product across truck or rail loading racks for transport to retail sites.
Although managing the task of moving the product through the distribution system is considered the marketing segment of the business, the ownership of the distribution assets and terminals varies, with many of these functions provided as third-party services.
Marketing is typically broken into two levels of trade: wholesale and retail.
Wholesale marketing handles the movement of product from the initial refinery distribution point to product terminals. The retail-marketing business supports the delivery of product from the racks to local gasoline stations and convenience stores, with sales to the end user.
Wholesale marketing is the next level of trade downstream from the refinery. Companies that own refining assets, independent marketers (or "jobbers"), and product trading companies all operate in the wholesale business sector.
Jobbers are companies that participate in various aspects of the marketing business segments from wholesale through retail. At one time, the term "jobber" mainly referred to an independent owner of retail sites, but the services provided by jobbers have expanded over time. Today a jobber may participate in both wholesale and retail functions.
The wholesale business buys refinery product and sells the product from terminals or "racks." Therefore, wholesale marketing typically buys product at a price related to spot prices and sells product at posted rack prices.
The terminals maintain product inventories and blend and monitor additive injection. Although proprietary terminals exist, many terminals operate as a service to the industry. The terminals provide product storage for several brands, with proprietary additive injection facilities on site to facilitate branded sales.
The wholesalers post prices for sale from the terminals where they have product available and may offer branded gasoline or diesel as well as unbranded-grade products.
Branded rack prices are usually at a slight premium to unbranded rack prices because they are part of long-term arrangements between an oil company and a dealer or retailer. The agreements associated with branded supply include trademark use and advertising for the brand and may also include security of supply, nominal station upgrades, and credit card services.
The unbranded rack price is the price available to a non-affiliated dealer for delivery to a non-branded retail station. Unbranded rack prices are generally at a slight discount to branded rack prices except in periods of short supply.
The next step in the value chain, transportation of the product from the terminal to the retail site, is often performed by the same company as the wholesale function but may also be provided by jobbers and independent truck operators. Some independent truck operators work on commission for the wholesalers.
Jobbers purchase gasoline at the rack or "spot," depending on the level of integration with the wholesale function, and sell gasoline through their own retail outlets or to third-party stations. They may market branded or unbranded gasoline, with some marketing multiple brands.
Retail sites may be owned or operated by oil companies, jobbers, or other third parties. In addition to owning and operating their own sites, oil companies may lease sites for independent operations by a dealer, or the dealer may operate the site on commission. Any combination of company-owned, leased, and operated or jobber-owned, leased, and operated is possible.
Oil companies capture different segments of the marketing value chain depending on their investments in distribution and marketing assets and their directed marketing channels. A company that owns refining assets may act as a "merchant refiner" by selling its product in large quantities into pipelines or barges for distribution. These sales tend to transact at or near spot-market pricing and allow the refiner to minimize its participation in the marketing business.
A company that owns refining assets, as well as product distribution and terminal assets, and company-operated retail stations (whether leased or company-owned) captures the entire marketing value chain through to the retail sale. This type of full integration by companies from refining all the way to retail marketing is not as common in the US as it once was.
Today, most companies that own refining assets participate in varying levels in the wholesale business and tend to minimize their investments in retail and distribution. These companies market the majority of their gasoline across the rack through third-party branded jobbers and independent marketers.
Currently, less than one-fifth of the gasoline produced in US refineries is marketed through company-operated stores.
Pricing points
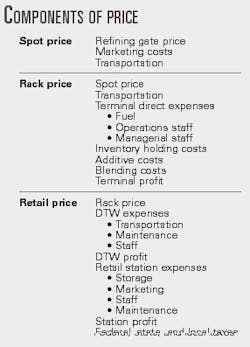
Fig. 1 details the components of price at each pricing point in the value chain. Spot prices are collected and published by a number of pricing services at major distribution centers. These prices represent the average of prices paid between buyers and sellers for a cargo of product.
The spot price, whether pipeline or barge, includes the refinery gate price, marketing costs associated with the bulk product sales, and transportation to the spot-price location.
The rack price is the price available at loading racks within terminals. Published rack prices represent the average of prices charged to dealers for a tank cargo of gasoline. Although discounts off the published rack price are available on a contract basis, they are not publicly available. The rack price is set by the spot price, plus additional transportation and marketing costs to cover the wholesale operation as well as terminal expenses and profit.
The retail price is the street price available to the consumer wherever gasoline is sold, including gasoline-only stations, convenience stores, and mass-marketers.
More than 88% of the gasoline sold in the US is through convenience stores. Retail prices are set by local competition and supply and demand. The retail price is set by the rack price, plus "dealer-tank-wagon" trans por tation and profit (covering the cost of distribution to the retail site); retail station costs; and profit, and federal, state, and local taxes.
Marketing profitability
Muse's gasoline-marketing profitability indicators are based on the gross margins obtained in the four metropolitan areas in the marketing of premium and regular gasoline.
The wholesale-marketing gross margin is calculated by the difference between the average local published rack price and the average Platt's spot price for the area.
Pipeline transportation from major refining centers is outside the margin calculation. Rack discounts are also not included but, to the extent that they exist, would shift profitability from the wholesale function to the retail function within the marketing segment.
The rack prices used for the Houston, New York, and Chicago markets reflect a weighted average price assuming 85% branded and 15% unbranded total sales in most months. Occasionally unbranded rack prices are temporarily highly inflated due to supply constraints or product changeovers. In these months, the analysis relies on the branded rack price as more representative of the broad market.
Similarly, in the Los Angeles market, unbranded rack volumes are thinly traded and the resulting unbranded rack posted prices are unreliable. The analysis therefore uses only branded rack prices in Los Angeles.
A rigorous analysis of the retail segment of the business would recognize the existence of an additional level of trade, referred to as the "dealer tank wagon" (DTW). The DTW segment transports product from the terminals to the retail sites. Retail stations pay a price for gasoline that includes the rack price and the DTW expenses and profit known as the "DTW price."
Because no reliable source for DTW prices is available, Muse has collapsed this function into the retail segment and determined an aggregated margin for the entire retail segment. The retail-marketing gross margin is calculated as the difference between the retail street price (excluding all taxes) and the local average rack price utilized in the wholesale-marketing margin.
Therefore, the retail-marketing margin covers the profits and expenses of both the retail station and the DTW owner.
Muse utilizes the US Department of Commerce retail prices for both premium and regular gasoline grades. These prices reflect the daily average of prices posted at the street for the relevant metropolitan statistical areas and include both self-serve and full-serve prices.
The four metropolitan areas analyzed are primarily reformulated gasoline (RFG) markets, although the Chicago and New York metropolitan areas include some small counties that are not RFG.
In Chicago, the RFG and conventional rack prices are volume-weighted to obtain a composite rack price reflecting the estimated percentages of RFG and conventional retail sales. In New York, because the portion of conventional-grade sales accounts for a very small fraction of the total sales, the RFG rack prices have been directly used in the analysis.
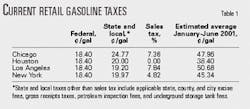
Muse computes an average tax for each metropolitan area that includes federal, state, and local gasoline sales taxes as well as any sales taxes that may apply. Each metropolitan area's average tax is based upon the estimated volume-weighted consumption within the corresponding counties comprising each area (Table 1).
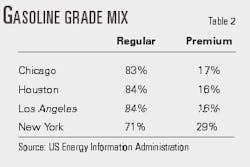
Both the retail and wholesale-marketing margins reflect the volume-weighted average margins for premium and regular gasoline sales. Mid-grade prices are typically priced as a set differential between premium and regular prices.
Consequently, Muse splits the mid-grade volumes between premium and regular for determining average sales. Table 2 details the percentage volumes between the grades utilized by Muse.
Historical perspective
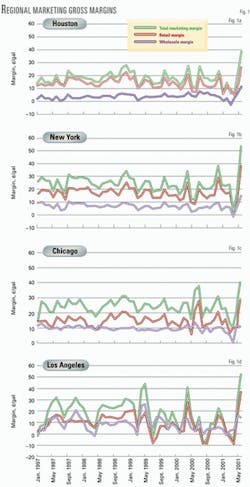
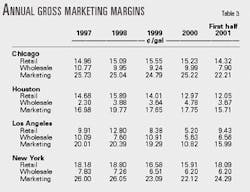
Fig. 2 shows the historical wholesale, retail, and total marketing margins for each metropolitan area. The total marketing margin is the sum of the whol esale and retail margin. Table 3 provides the corresponding annual average gross margins.
Although the annual average wholesale and retail gross margins in most locations are stable compared to gross margins in other segments of the energy industry, there is considerable monthly volatility and there are significant regional differences.
Houston is the most competitive of the wholesale markets in terms of gross margin available to the wholesaler. This is most likely due to the abundance of local gasoline supply options and the large number of refineries in the area with their own terminals.
The most volatility in wholesale gross margin is seen in Los Angeles, which is a result of the dramatic fluctuations in price that occur on the West Coast as supply disruptions or other events occur that affect the market.
Retail gross margins are both most volatile as well as thinnest in the Los Angeles market. The volatility results from the same factors as those that affect the wholesale margin, while the low absolute margins reflect the highly competitive retail market in the Los Angeles area.
Premium vs. regular margins
The marketing margins provided in Fig. 2 and Table 3 are volume-weighted averages for all grades of gasoline in each area. An analysis by grade shows that the greatest gross margin occurs on the premium grades at both the wholesale and retail level of trade.
With New York and Houston as examples, the retail price differentials between premium and regular have averaged about $0.17/gal in New York and Houston in the last 41/2 years. Fig. 3 shows how refiners, wholesalers, and retailers share this price differential.
The spot-price differential is the portion of the retail-price difference that accrues to the refiner. The refiner requires a higher spot price for premium vs. regular to compensate for the higher cost of production.
As shown by the bottom line on the graphs in Fig. 3, the differential in the spot price fluctuates quickly with supply and demand fundamentals. The spot price differential has averaged $0.038/gal in Houston and $0.054/gal in New York over the period analyzed. At times, the price differential is insufficient to cover the incremental cost of producing the premium products.
The wholesale margin differential is the difference in gross margin the wholesaler makes on premium vs. regular gasoline. As Fig. 3 shows, the wholesale price difference between premium and regular is very stable with almost no fluctuation in Houston and minimal fluctuation in New York.
On average, premium rack sales occur at about $0.09-0.10/gal over regular gasoline. This is well above the spot price differentials of $0.04-0.05/gal, on average, and allows the wholesaler to enjoy a larger gross margin on premium than regular as shown by the red region in Fig. 3.
The incremental gross margin on premium sales compensates the wholesaler for the increased operating costs of distributing a separate product and higher per-volume unit expenses associated with holding and distributing a smaller volume product.
At times, however, the traditional relationships do not hold and the wholesaler can be in situations where spot-price differentials exceed the rack-price differences, and the wholesaler either has little incentive to sell premium or may experience negative gross margins.
Similarly, the absolute price difference between premium and regular at the retail level is fairly consistent, averaging $0.17/gal in both New York and Houston. The resulting incremental gross margin available to the retailer for premium gasoline sales averages about $0.08/gal, as shown by the yellow regions in Fig. 3.
This demonstrates that the retailer captures a significant portion of the premium-regular price differential, with a significantly higher margin on premium gasoline sales. A portion of this margin results from the need by the retailer to cover the incremental operating and capital costs associated with selling an additional, smaller volume product. The retailer also takes a portion of the absolute price risk.
In times of high gasoline prices, consumers downgrade their gasoline purchases, lowering demand for premium gasoline in particular and, consequently, the prices of premium gasoline.
Fig. 3 also shows the absolute price of regular gasoline to provide a reference point on the variability of the premium vs. regular price differential as retail prices increase or fall. Although the fact that demand for premium grades falls as the absolute price increases is well documented, this analysis shows that any price reductions by the retailers to stimulate premium demand over regular are minimal.
Seasonality; recent trends
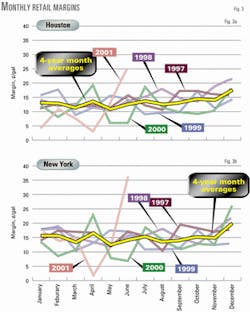
Fig. 3 shows the total retail margins for Houston and New York by month for each year and makes clear that there is no significant seasonality in the margins.
The charts also demonstrate the unusual margin patterns that have occurred in 2001. As spot prices increased in the spring in anticipation of a tight summer gasoline market, retail margins were squeezed, but as spot and wholesale prices fell in early summer, retail margins skyrocketed to record highs, recapturing lost ground for the year.
The authors
Kathy G. Spletter is a vice-president and director of Muse, Stancil & Co., Dallas. She leads the valuation services practice area for the firm. She worked for Mobil Corp. before joining Muse in 1987 and has more than 20 years' experience in the energy industry. She holds a BS in chemical engineering from Texas A&M University, College Station, and is a registered professional engineer in Texas. Spletter is also an accredited senior appraiser of the American Society of Appraisers.
Susan L. Starr is a principal with Muse, Stancil & Co. and has more than 13 years' experience in the energy industry. She holds BS and MS degrees in chemical engineering from Oklahoma State University, Stillwater, and an MBA from Southern Methodist University, Dallas.

