Best practices determine refinery pacesetter performance
Implementation of better refinery work practices drives improvement in cost efficiency, the numerator in the $/bbl cost equation. These best practices explain the widening difference between the performance of pacesetter and fourth-quartile ranked refineries.
There is a widely held myth in the refining industry that after several years of focused cost reduction, refining costs can no longer be reduced.
While refiners have reduced the costs of refining as measured by most any measure during the past 20 years, the range in performance between the best and worst performers has widened. The widening gap between best and worst performers indicates that significant cost-reduction opportunities remain across a wide cross section of the refining industry.
A second widely held myth is that the secret to reducing costs is increasing refinery throughput. While focusing on capacity, or the denominator in the $/bbl cost equation, has been an effective means of reducing costs for many refiners, it ignores the role of true improvement in cost efficiency.
Comparing operating costs
Different types of refineries experience different levels of operating costs.
A more complex refinery typically has a higher total cash operating cost than a less sophisticated refinery. A larger refinery generally has a higher total cash operating cost than a smaller refinery.
Examining refinery operating costs on a $/bbl basis is not adequate to account for the many differences in refinery capacity and complexity. Thus, Solomon Associates Inc. developed equivalent distillation capacity, a method for comparing the operating costs of refineries.
EDC provides a statistically tested method to compare cash operating costs of different refinery types and sizes.
Although both Nelson complexity factors and EDC factors try to create a "universal divisor" to allow meaningful comparisons of refineries, EDC differs significantly from Nelson factors. Nelson factors are based on investment cost, while EDC is based on the resources needed to operate a refinery (see box).
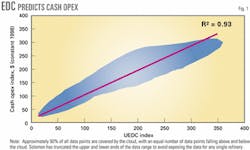
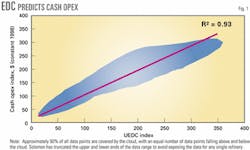
Fig. 1 shows the correlation between cash operating cost index (opex index) and utilized EDC index (UEDC index) for 1994, 1996, and 1998. The data for each year cover a constant set of about 80 North American refineries. The data for cash operating cost are in constant 1998 dollars. Both the cash operating cost and UEDC are expressed as indices in each of which the 1998 average = 100.0.
The linear correlation shown in Fig. 1 between the opex index and UEDC index has an R-squared of 0.93, indicating 93% of the variation in cash operating cost index can be explained with the variation in UEDC index. Thus, UEDC is a good basis for comparing refinery cash operating costs.
Operating cost history
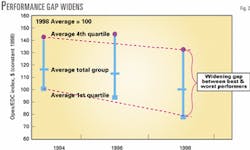
Fig. 2 shows the average cash operating cost per UEDC (opex/UEDC index) for 1994, 1996, and 1998, and the average opex/UEDC index for the first and fourth quartiles for the same years. Fig. 2 clearly shows the improvement in average cost and the widening gap between the best and worst performers during the 1994-98 period.
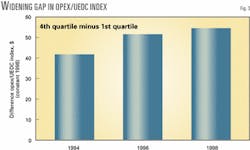
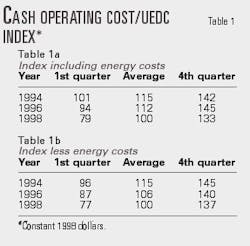
During the 1994-98 period, the opex/UEDC index decreased from 115 to 100, or by 13% (Table 1a). During the same period, the average of the first-quartile opex/UEDC index fell by 22%, and the average fourth-quartile opex/UEDC index fell by only 7%. While average operating costs have decreased, the gap between the best and worst performers has widened (Fig. 3).
Further examination of the data in Table 1a shows the gap between the worst and best performers widened by 13 points during 1994-1998, while the average indices of the first and fourth-quartile performers improved 15 points. The performance gap is widening almost as fast as the average is improving.
One might expect the wide fluctuations in energy costs during 1994-1998 created a cash operating cost trend driven solely by changing energy prices. Table 1b shows that cash operating cost less energy varied in a similar manner to cash operating cost including energy during the same 4-year period. This indicates that the ability of a refiner to reduce energy costs mirrors its ability to reduce costs in other areas.
Impact of capacity
Further analysis of the changes in the first and fourth quartiles during 1994-1998 reveals a significant difference in the activities of the first and fourth-quartile refiners.
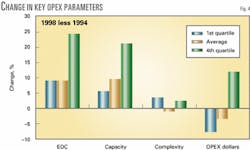
Fig. 4 shows in spite of widening opex/UEDC index gap, the fourth-quartile refiners increased EDC and capacity more than the better performing first-quartile refineries. Although the first-quartile refiners also increased EDC and capacity, they did so only in amounts similar to the group on average.
What emerges is the fact that first-quartile refineries increased EDC and capacity while decreasing the total dollars spent on cash opex.
Keep in mind in this analysis that the makeup of each quartile changes each period. The refineries in the fourth quartile in 1994 are not all the same refineries in the fourth quartile in 1998. Some locations start in the fourth quartile and stay there, while others gradually work their way into the poor performance category.
These data suggest a migration of refineries with larger than average capacity increases into the fourth quartile. At the same time, refineries that migrated into the first quartile had average increases in capacity but larger than average reductions in total dollars spent on operating costs (Fig. 5).
Best practices
We have seen that improvements in operating costs are not solely driven by capacity additions. Experience says that best practices account for most of the change in opex/UEDC index not associated with changes in capacity.
Best practices include the design, operation, management, and culture of a refinery. "What you do and how you do it" really matters when it comes to reducing refinery costs.
In addition, "slash and burn" tactics do not achieve sustainable cost reductions. Refiners who focus on upgrading their business practices have a greater chance of sustaining their move up the cash operating cost quartile ranking than do refiners who solely focus on cutting costs.
All too often, management cuts costs without changing the process. The result is often a short-term cost reduction and a long-term performance reduction.
A large portion of the North American refining population has significant opportunities to improve operating cost performance. A balanced program that looks at capacity additions and the implementation of better work practices is the key to long-term pacesetter performance.
The author
Michael J. Hileman is a vice-president with Solomon Associates Inc., a division of HSB Solomon LLC, Hartford, Conn. Before joining Solomon, Hileman was vice-president of supply, distribution, and sales for a large independent refiner-marketer. He holds a BS in chemical engineering from Rose-Hulman Institute of Technology in Terre Haute, Ind.
