Study looks at tight-gas restimulation candidate wells
A study evaluated new and advanced techniques for identifying, in an effective and cost-efficient manner, high-potential restimulation candidate wells in large, tight gas fields.
The Gas Technology Institute (GTI, formerly the Gas Research Institute, or GRI) study looked at three techniques: production statistics, virtual intelligence, and type curves. These techniques progress from the relatively simple with a minimum of data requirements to full-fledged engineering studies requiring comprehensive data sets.
The initial results of GTI's work indicated a substantial potential for adding reserves, particularly in the tight gas sands of the US Rocky Mountain, Mid-Continent, and South Texas regions.1
The techniques, applied at three test sites, showed that each candidate selection method picks different candidate wells based on different criteria. But based on this study, each selection method seems to be effective in a different environment.
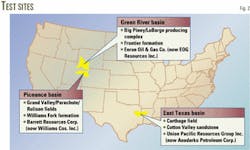
The three test sites were: Green River basin, Frontier formation, Piceance basin, Williams Fork formation, and East Texas, Cotton Valley sandstone.
Of the nine wells restimulated at the three sites, the study considered that on an individual basis only six treatments were economically successful. But for all nine, the treatments increased incremental reserves by 2.9 bcf at an average $0.26/Mcf cost, indicating a highly successful program, even when accounting for the unsuccessful restimulations.
For the successful treatments, the study found that restimulation added incremental reserves at a $0.10-0.20/ Mcf cost.
Study objectives
The industry has had mixed experience with restimulation because of the considerable efforts required for candidate selection, problem diagnosis, and treatment selection, design, and implementation.
Realizing the industry's lack of specialized restimulation technology, GTI in 1998 initiated the multiyear research and development project with four objectives:
- Develop effective methodologies to identify wells with restimulation potential.
- Identify themechanisms leading to well underperformance.
- Develop and test new restimulation techniques.
- Demonstrate that restimulation can improve well recoveries and economics.
This article discusses the activities and results of the first objective of developing effective methodologies to identify wells with restimulation potential.
Candidate selection
GTI believes that development of a candidate selection method has the most potential for advancing restimulation technology that will provide the greatest benefit to industry.
In an earlier GTI work, an important finding was the "85/15" rule.1 This rule, borne out by broad industry experience, states that 85% of the restimulation potential for a field exists in 15% of the wells. The key to any successful restimulation program, therefore, is being able reliably to identify the 15% of the wells with the highest potential for a successful restimulation.
Restimulation economics are sensitive to proper candidate selection, and relatively minor miscalculations can turn what otherwise could be a highly profitable project into an unprofitable one.
Inadequate candidate selection procedures appear to be why many restimulation projects are unsuccessful economically.
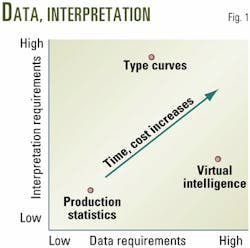
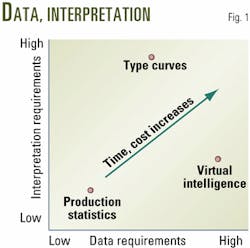
GTI, therefore, developed a three-step candidate selection method for subsequent field-testing. The process included production statistics, virtual intelligence, and type curves. By design, the methods progressed from a simple, non-analytical approach to full-fledged engineering with increasing data requirements and cost (Fig. 1).
Production statistics
In simplest terms, the production statistics process essentially compares production performance of each well in a localized area to its offsets and identifies under-performing wells that could be restimulation candidates. The drawback of this approach is that it does not identify those high-productivity wells that could provide the most favorable restimulation economics.
Furthermore, in fields with high reservoir heterogeneity, as with many tight, naturally fractured plays, production comparisons alone cannot distinguish between the effects of reservoir variability and completion effectiveness.
The selection of under-performing wells particularly where reservoir properties are relatively uniform is, nevertheless, an approach worthy of evaluation.
Virtual intelligence
The second analytic process used virtual intelligence to identify potential restimulation candidates.
Artificial neural nets can recognize subtle patterns in how various input parameters (e.g., geologic, drilling, completion, stimulation, workover and location data) affect the output (i.e., production). Essentially, one develops a well-performance model with pattern-recognition technology, instead of an engineering-based relationship.
One then uses genetic algorithms to optimize the controllable input parameters (e.g., completion and stimulation parameters) for each well to determine the wells with the greatest discrepancies between actual and optimized well performance. These wells are the best restimulation candidates.
The difficulty with this overall approach is that frequently the amount and type of data available are insufficient to perform a meaningful analysis. The analysis requires that all technical data must be available for all wells. As a result, this approach can be compromised by the lack of important well performance information such as reservoir properties.
Nevertheless, GTI believes this approach has great potential for understanding and optimizing well performances in tight gas fields.
Type curves
The ideal approach for selecting restimulation candidates is to understand directly the relative impact of reservoir properties and the completion on each well's performance. For restimulation, one would then select wells with high permeability and high skin. Unfortunately, this information is expensive to obtain with conventional pressure-transient analysis.
An alternative approach uses production type curves, although this approach has several difficulties:
- Models typically are for single-layer reservoirs, and the multilayered nature of most tight sand plays render the results suspect.
- The noise level of the production data normally available and the inherent interdependencies of the output parameters makes reaching a unique solution difficult.
- Obtaining the values of net pay, porosity, and saturations for each well requires some interpretive and potentially labor-intensive petrophysical evaluation.
Recognizing these limitations, however, one can still use type-curve approaches in a relative sense for identifying potential restimulation candidates.
Final well selection
It should be pointed out that while these methods will identify restimulation candidate wells, one needs to do further evaluation of the selected candidates on an individual basis before making final well selections and specifying intervals within the wells.
The further evaluation includes such topics as mechanical integrity, pressure screening, economic evaluation, and candidate verification testing.
Field application
An important project objective was to demonstrate the application of each candidate selection method, as well as the other technologies developed under the project, at up to four test sites in tight gas plays in the US Rocky Mountain, Mid-Continent, and South Texas regions. Each site had to have 200-300 wells, of which 5 would be selected for restimulation.
For various reasons, GTI only selected three sites (Fig. 2).2
As discussed earlier, the analysis intended to use production statistics as an initial screening tool, virtual intelligence as a second prioritization step, and type curves as a final selection method.
To ensure that the initial steps did not eliminate wells that might be selected by subsequent analyses, the evaluation initially applied all three methods to all wells in the first test site in a parallel fashion such that the selections could be crosschecked.
Thus, in the Green River basin, the study evaluated more than 200 wells with each technique. Once this was completed, the study listed and compared the top 50 candidate wells from each process. Interestingly, the coincidence of candidates from one process to the next was inconsistent. Only a few wells made the top 50 list for all three processes. Further, the very top candidates from each process were unique to that process, and were not identified by the other processes.
Because of this finding, all three processes were also performed on all wells at the remaining two sites, with a similar result. The implication is that since each method focuses on different indicators of restimulation potential, each selects different candidate wells.
For example, production statistics selects wells that are under performing compared to their offsets. Virtual intelligence selects wells where "less-than-best" practices were originally employed, and type curves select wells with the greatest estimated upside potential, albeit using non-unique engineering methods.
Without a clear indication of which process selected the best candidates or if each process provided high-potential candidates with different characteristics, the study included a subsequent analytical step at each site. The step selected for detailed individual reviews the candidates that appeared on more than one top 50 list, together with the 5 top-ranked wells unique to each list. Each case had about 50 wells.
Each of these candidate wells was then individually reviewed for mechanical integrity, evidence of sufficient reservoir pressure, apparent cause of underperformance, and economic viability. Operator preference was also a strong consideration in the selection because of the cooperative nature of the project.
This process yielded 5-10 candidates for restimulation at each site.
Restimulation results
Ultimately, nine wells were restimulated at three sites. All but one were refracturing treatments, and as the project progressed the treatments trended:
- Away from heavy gelled fluids.
- Towards ungelled water, with inclusion of a gas to assist post-treatment fluid cleanup.
- Towards single-stage treatments using ball-sealers to effect treatment diversion at preselected points in the pumping schedule. Single-stage treatments reduced cost over multistage treatments.
Tiner contains further details on the actual treatment designs, their rationale, and the field implementation.3
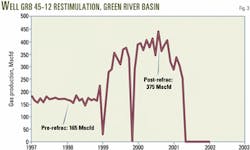
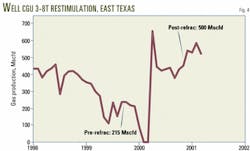
Figs. 3 and 4 show the results of two of the treatments.
Performance comparisons
The study analyzed the combined results of all nine wells to understand the performance of each methodology in terms of selecting candidates and the results of the restimulation treatments.
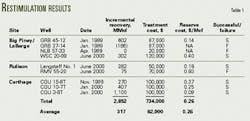
First, the study computed the ultimate incremental recoveries for each well with standard decline-curve approaches and estimated the costs of each treatment. This provided for a calculation of an undiscounted incremental reserve cost (Table 1).
In Table 1, note that each treatment was classified as being successful if the incremental reserve cost was less than $0.75/Mcf.
Based on this criterion, the study found that six of the nine treatments were successful. Note that the six successful treatments each had an incremental reserve cost of less than $0.40/Mcf.
Despite one-third of the treatments being unsuccessful, the combined results of all nine wells yielded 2.9 bcf of incremental reserves at a $734,000 cost. The average reserve cost was $0.26/Mcf. Thus, even when one accounted for the unsuccessful cases, the overall program was highly successful.
On average, a restimulation yielded 0.3 bcf/well at an $82,000 cost. Note that the analysis does not include in the treatment cost any special diagnostics run purely for the purpose of this R&D project. The analysis includes only those costs actually incurred for implementation of the treatment.
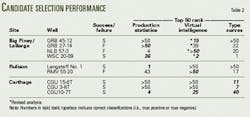
Next, the study examined the ability of each process to select correctly the successful candidates or correctly not to select the non-candidates. Based on the previous criteria for success, the study assigned a correct candidate selection if the treatment was a success and the well appeared on the top 50 list for that method. Conversely, a correct result was also assigned if the treatment was unsuccessful and the well did not appear on the top 50 list for that method (Table 2).
These results (Table 2) suggest each technique successfully predicted a candidate or non-candidate in four (five in the case of virtual intelligence) out of nine cases. Each technique, however, appeared to have its best predictive performance at a different test site.
In the case of production statistics, this method did reasonably well in the Piceance basin, virtual intelligence worked best in the Green River basin, and type curves worked best in East Texas.
It should be pointed out that in the case of the Green River site, the study tested a revised virtual intelligence approach. In this new approach, the study used a fuzzy logic decision algorithm to incorporate other information, such as current reservoir pressure and completion practices, into the selection process, as opposed to only using the results of the genetic algorithm. Table 2 shows that this new approach appeared to work very well.
As the results of this project suggest, each candidate selection methodology appears to select different wells for different reasons, each of which may be valid. For example, production statistics selected wells that are under-performing its offsets. While this under performance could be a consequence of poor reservoir quality, the process should be valid where reservoir quality is more uniform.
Virtual intelligence selects wells whose original completion or simulation procedures are less than optimum.
Type curves tend to select wells based purely on incremental production potential, and thus weigh more heavily towards the better producing wells.
Ultimately, the ideal candidate selection process may be a combination of all three methods, each of which should be assessed for applicability at any particular site. In general, based on the experience from this project, application of each method could be driven by the following guidelines:
- Production statistics should be considered when reservoir quality is relatively uniform and production has been relatively stable.
- Type curves should be considered when production data quality is good and petrophysical information is available.
- Virtual intelligence methods should be considered when reservoir, completion, or stimulation complexity is high.
Project benefits
Table 1 provided the incremental recovery and cost data for the nine restimulation treatments performed in this project. If one assumes a benchmark $0.75/Mcf finding and development cost based on recent corporate acquisition activity that accounts for value assignment other than proved reserves, then the direct financial benefits created as a result of this project are $1.4 million (2.9 bcf 3 ($0.75/Mcf 2 $0.26/ Mcf)), for the three cooperative research partners combined.
This exceeds the cost of the R&D itself, and hence the project had an overall positive value. This suggests that if a company undertakes a similar effort on its own, it would achieve full payback of the R&D investment with only a nine-well program.
One can easily envision that if a larger program were to be implemented (i.e. more than nine wells), a restimulation program that adopts a careful approach to candidate selection could be highly profitable.
Recommendations
A universally applicable, multistep candidate-selection methodology remains elusive. The three different individual techniques tested, however, each proved to have strengths and weaknesses and seemed to be applicable to at least one of the three sites in this project.
For a candidate-selection process, it is recommended that the site where a restimulation program is being contemplated first be characterized with respect to general reservoir properties, historical completion and stimulation practices, and data availability and quality. After this characterization, one can then choose and apply the candidate selection method, or combination of methods, based on the guidelines presented previously.
As mentioned previously and described more fully in Reeves,4 the inclusion of a fuzzy-logic component in the virtual intelligence approach can markedly improve its performance. While the study tested this new approach only in the Green River basin, with apparently very good results, it is believed that this new virtual intelligence approach holds considerable promise.
Further, the direct financial benefits of the project exceeded its costs, suggesting that commercial-scale efforts of this kind, internally funded by oil and gas operating companies, could be highly profitable.
References
- Reeves, S. R., Assessment of Technology Barriers and Potential Benefits of Restimulation R&D for Natural gas Wells, Final Report to the Gas Research Institute, GRI-96/0267, July 1996.
- Reeves, S. R., Development and Testing of a Restimulation Candidate Selection Methodology for Complex Tight Sand Reservoirs, Topical Report to the Gas Technology Institute, GRI-01/0145, July 2001.
- Tiner, R. L., Detail Well Analysis, Treatment Design and Job Execution for the Restimulation of Natural Gas Wells, Topical Report to the Gas Research Institute, GRI-01/0146, May 2001.
- Reeves, S. R., Benchmarking of Restimulation Candidate Selection Techniques in Layered, Tight Gas Formations Using Reservoir Simulation, Topical Report to the Gas Technology Institute, GRI-01/0021, January 2001.
The authors
Scott Reeves is executive vice-president of Advanced Resources International Inc., Houston. Reeves has a BS in petroleum engineering from Texas A & M University and an MBA from Duke University.
Steve Wolhart is manager, reservoir diagnostics for the Gas Technology Institute, Houston. He has a BS in mechanical engineering from Texas A&M University and a MBA from Southern Methodist University. He is a member of SPE, Petroleum Society (Canada), and the American Rock Mechanics Assoc. He is a registered professional engineer in Texas.
