Profits, production, reserves increase for OGJ100 firms
Oil & Gas Journal's latest look at the top 100 oil and gas producing companies based outside the US shows that profits were up worldwide last year, and production and reserves increased after dipping in 1999.
There were few changes from last year in terms of the production and reserves leaders, as state-owned companies continue to dominate both lists.
The OGJ100 list of major non-US companies allows comparison of size and performance of prominent companies throughout the world. The companies are listed by region according to the location of corporate headquarters rather than ranked by assets or revenues, because many do not report financial results.
For the Canadian companies included in this edition of the OGJ100, net income jumped 247% last year on revenues that were 65% higher than in 1999.
Profits of the OGJ100 companies based in Europe and the former Soviet Union reporting financial results collectively increased 97%, while revenues moved up 48% last year.
Production, reserves
IEA estimates that worldwide demand last year increased to 75.9 million b/d from 75.2 million b/d. Responding to demand and stronger prices, production edged up also.
The combined crude and condensate production of the top 20 producers based outside the US averaged 43 million b/d, or 64% of total worldwide output of crude and condensate for 2000. During 1999, total output of the 20 production leaders averaged 42.6 million b/d.
As in past editions of the OGJ100, half of the top 20 companies in terms of production are located in nations belonging to the Organization of Petroleum Exporting Countries. In recent years, though, a few nongovernment companies outside OPEC have been climbing the list.
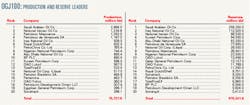
Reporting crude production of 832 million bbl last year, Royal Dutch/Shell has moved up to No. 6 from the No. 7 producer in the previous OGJ100.
PetroChina Co. Ltd. is new to the OGJ100 this year. As part of a restructuring of China National Petroleum Corp. (CNPC), most of the assets and liabilities of CNPC relating to its exploration and production, refining and marketing, chemicals, and natural gas business were transferred to PetroChina in November 1999.
With 765.4 million bbl of crude output last year, PetroChina ranks at No. 7 on the list of production leaders.
With crude production of 690 million bbl, BP PLC falls to No. 10 from No. 8 last year, while OAO Yukos has jumped to No. 17 from No. 19 with total year 2000 crude output of 362 million bbl.
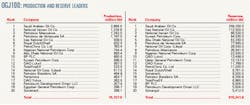
Saudi Arabian Oil Co. continues to head the list of production leaders, increasing its crude output to 2.9 billion bbl from 2.66 billion bbl a year earlier, as well as the list of reserves leaders. With reported crude reserves of 259.25 billion bbl, Saudi Arabian Oil Co. far exceeds the second leading company, Iraq National Oil Co., with 112.5 billion bbl in reserves.
Based on the latest OGJ estimates, the top 20 reserves leaders control 89% of total world crude oil reserves.
If the top 20 production and reserves leaders tables included international oil companies headquartered in the US, ExxonMobil Corp. would rank 6th in worldwide liquids production and 13th in worldwide liquids reserves. Chevron Corp. would be 17th in terms of worldwide liquids production; but unlike a year ago, with 5 billion bbl in worldwide liquids reserves, it would not make the list of reserve leaders.

