OGJ200 shrinks as financial results rocket
The consolidation trend has shrunk the OGJ200 list of publicly traded US oil and gas producers to 197.
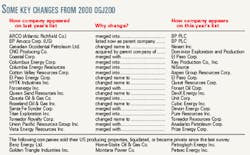
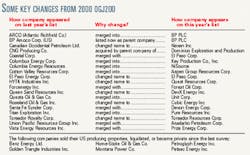
A dozen of the companies in last year's list (OGJ, Oct. 16, 2000, p. 90) fail to appear in the listing this year, having been folded into other entities as a result of mergers and acquisitions (see table on this page).
In addition, six companies listed last year have either sold their US producing properties, liquidated, or become private since the last survey and therefore are no longer eligible to appear in the OGJ200.
This annual compilation-which reflects the prior year's operations-came to life as the OGJ400, and then it became the OGJ300 in 1991. The last time the OGJ list was cut in size by consolidation was 1996.
Although this year's OGJ200 group consists of fewer companies, earnings were much higher.
Strong demand and supply constraints propelled oil and gas prices last year, which in turn gave drilling activity a boost. International Energy Agency figures show that worldwide demand for petroleum products was 75.9 million b/d last year, up 700,000 b/d from the year before. In response to these factors, capital and exploration spending by the OGJ200 group surged 19% last year.
Many of the companies' efforts were rewarded with record profits and a hefty return on stockholder equity.
Record profits
Last year's financial results for the OGJ200 group of companies showed impressive gains, as both higher commodity prices and strong operating performance contributed to record profits for many in the group.
Addressing shareholders in the Chevron Corp. annual report, Chairman and CEO Dave O'Reilly said, "The most historic achievement of 2000 was our net income of $5.2 billion, by far the highest in the company's 121-year history. That performance benefited from sustained high prices for crude oil and natural gas, combined with strong refining margins, particularly in the United States. Underlying these results, however, was solid operating performance."
Total net income for the OGJ200 group was $73 billion, up from $22 billion a year earlier. Revenues increased to $625 billion from $458 billion.
Comparisons between totals for one year's OGJ200 with those for another year must take into account the company changes that occur, but for any given year the list represents a substantial part of the US oil and gas industry.
The OGJ200 ranks companies by assets, disregarding whether they use full-cost or successful-efforts accounting methods.
Total assets for the OGJ200 group increased 5% last year to $503 billion. The top five companies in this year's group account for 58% of this total. The highest total assets for an OGJ200 group were yearend 1997 assets of $522 billion.
Total stockholder equity for the companies in this year's group moved up 10% from last year to $183 billion.
The market
Robust prices in 2000 gave the OGJ200 group of companies a boost in revenues. While oil prices had a stronger than average year, natural gas prices set records.
US wellhead prices for crude oil rebounded to average $26.74/bbl in 2000 from $15.53/bbl a year earlier and $10.84/bbl in 1998.
The world export price of crude oil continued to climb as well, reaching an average of $31.15/bbl in September, the highest for a month since October 1990, when the average was $33.00/bbl. For all of last year, the average world export price of crude oil was $27.51/bbl, up from $17.37/bbl in 1999 and $11.91/bbl in 1998.
The average US composite refiner acquisition cost for both domestic and imported crude oil surged to $28.22/bbl last year compared with $17.41/bbl in 1999 and $12.54/bbl the previous year.
In spite of high crude costs, refining margins contributed to strong company returns as product prices held strong. The gross refining margin on West Texas intermediate crude for Chicago-area refiners last year averaged $5.59/bbl, according to Pace Consultants Inc. Plump product prices pushed the margin in May to an average $8.15/bbl, then in June to $12.08/bbl. By July prices had eased on increasedproduct supplies, and the refining margin retreated to $3.33/bbl. The Pace Chicago WTI refining margin for 1999 averaged $2.48/bbl.
The average pump price for all types of motor gasoline in 2000 was $1.56/gal, up from $1.22/gal and $1.12/gal in 1999 and 1998, respectively.
Natural gas closing futures prices on the New York Mercantile Exchange (NYMEX) escalated throughout the year to average $8.32/MMbtu in December from $2.37/MMbtu in January, putting the annual average at $4.26/MMbtu. In 1999, the near-month futures price of natural gas averaged a more typical $2.31/MMbtu.
Drilling activity
Higher oil and gas prices and demand spurred a sharp increase in US drilling activity last year. OGJ estimates that the total number of well completions in the US last year was 25,945, up from 18,180 a year earlier (OGJ, Jan. 29, 2001, p. 85).
The Baker Hughes US annual average rig count increased last year to 918 from 625 a year earlier and 827 in 1998, but remained below the 1997 count of 943.
The annual Canadian rig count also gained, averaging 345 last year compared with the 1999 average of 245.
The international rig count, which excludes the US and Canada, rebounded last year to 652 from 588 the year before. In 1998 the international rig count averaged 755, down from 809 the prior year.
The number of US net wells drilled last year by the OGJ200 companies was 13,127 vs. 9,169 net wells drilled during 1999 by last year's group.
Capital and exploration expenditures last year by the OGJ200 group totaled $60 billion. The previous OGJ200 group reported total capital spending during 1999 of $50 billion.
Group operations
In spite of the increased drilling and capital and exploration expenditures, operating indicators mostly moved lower last year. Production was lower, while changes to reserves were mixed for the group.
Worldwide liquids production and natural gas production for the 200 companies each fell last year by 5% as compared with 1999 output of the previous OGJ200 group.
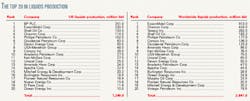
The group's worldwide liquids output totaled 3 billion bbl, while its US liquids production declined by 14% to 1.4 billion bbl.
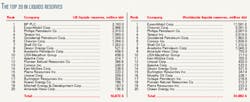
US liquids reserves for the group stood at 19.3 billion bbl at the end of last year, down from 19.4 billion bbl a year earlier. The group's worldwide liquids reserves grew, however, to 37.9 billion bbl from 37.6 billion bbl.
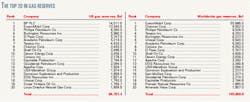
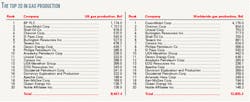
The OGJ200 companies produced 15.9 tcf of natural gas worldwide last year, and 11.5 tcf of this was in the US. Worldwide natural gas reserves of the group crept up last year to 183.3 tcf from 180.3 tcf. The group's natural gas reserves in the US, though, grew 11.5% to 119 tcf.
Group financial performance
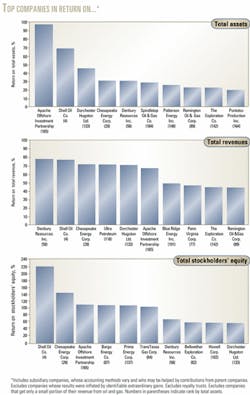
At 40%, return on stockholder equity far exceeded any level previously reached by an OGJ200 group.
Return on stockholder equity was 13.4% for 1999 results and 2.3% based on 1998 financial performance. Until this year, the highest return on stockholder equity recorded by an OGJ200 group was 17.6% for 1996 results.
Twelve of the companies on the current list exceeded 100% return on stockholder equity. Last year, only two companies could make this claim, and both were royalty trusts.
Return on assets and return on revenues also reached unprecedented levels for an OGJ200 group. Total return on assets increased to 14.5% from 4.7% a year ago. For 1998 results, return on assets was 0.8%. Before these latest results, the highest return on assets posted by an OGJ200 group was 6.6%, based on 1996 financials.
Total return on revenues set a record at 11.7%, also besting the previous record set in 1996 of 5.8%. Based on 1999 performance, the OGJ200 group posted a 4.9% return on revenues vs. 0.9% for 1998 results.
The number of companies in the group that posted a profit last year is up sharply to 165 vs. 118 in the previous OGJ200 group.
Those companies in the group that posted a profit exceeding $100 million also increased, with 32 organizations making the cut compared with 21 a year ago. Weak financial results for 1998 meant that only 12 companies fell in this category the prior year.
As was the case with the last OGJ200 group, only one company recorded a net loss of more than $100 million. But 1998 results pushed 23 of the OGJ200 companies into such heavy losses. Only four companies in the group had a loss of more than $100 million in 1997, and there were none in 1996.
Changes in the group
The OGJ200 group this year contains 18 companies that were not on last year's list. Of these, 13 are new to the list, and five have been on the list in previous years.
Three publicly traded limited partnerships ranked in the OGJ200 this year compared with just two last year. The largest LP is Energy Partners Ltd. with $208 million in assets. As in the past 2 years, the smallest LP in the list is Apache Offshore Investment Partners with $8.7 million in assets.
The list includes five companies operating in the US as units of non-US energy companies. These are BP PLC, Shell Oil Co., Chieftain International Inc., Ivanhoe Energy Inc., and Nexen Inc. Last year's list also contained five such companies. While other non-US companies have US operating units with reserves and production in the US, they do not provide separate data for operating and financial results and thus do not qualify for the OGJ200.
There are six companies in the group that are royalty trusts. The previous three lists each had seven royalty trusts.
The number of firms that posted a net loss in 2000 was down sharply from the prior year. There are 34 companies in the group with a net loss vs. 82 last year.
Twelve companies in this year's OGJ200 group have negative stockholder equity, down from 17 in the previous compilation.
As was the case last year, the top 100 companies combine for 99.3% of total assets for the entire group of 200 companies.
The smallest asset value in the top 100 increased to $128.9 million from $119.2 million in last year's group, but remains below $139.6 million in assets for the 100th company listed the previous year.
Top 20 companies
A few big movers scale the ranks as growing independents approach the majors in terms of total assets in the top 20 of this year's OGJ200 group.
Anadarko Petroleum Corp., Houston-which merged with Union Pacific Resources Group Inc. in July of last year-now ranks at No. 9 with $16.6 billion in total assets at the end of 2000, up from No. 19 with $4.1 billion in total assets a year earlier.
The oil and gas arm of El Paso Corp., also based in Houston, moved up to No. 17 on this year's list from No. 30, chalking up a 334% increase in assets primarily as a result of its merger with Coastal Corp.
Dominion Exploration & Production Corp., with headquarters in Richmond, Va., vaulted to No. 18 from No. 32. Also entering the top 20 are Murphy Oil Corp., El Dorado, Ark. at No. 19, previously listed at No. 23, and Houston-based EOG Resources Inc., which moves up to No. 20 from No. 22.
ExxonMobil Corp. and Chevron retain their positions at No. 1 and No. 2, while the US operations of BP PLC move up one spot to No. 3.
Shell Oil Co. ranks at No. 4, up from No. 6, and Texaco is No. 5 vs. No. 3 a year earlier.
Phillips Petroleum Co. is up three places to No. 6 and Occidental Petroleum Corp. is up four spots to No. 7.
Conoco Inc. drops one place to No. 8. USX-Marathon Group falls two spots to No. 10.
Amerada Hess Corp. advances two places to No. 11, while Unocal Corp. remains in the No. 12 spot. Kerr-McGee Corp. moves up to No. 13 from No. 16 and Burlington Resources Inc. is at No. 14, the same rank that it held last year.
Apache Corp. and Devon Energy Corp. each move up two places to occupy the No. 15 and No. 16 spots this year.
The top 20 companies continue to dominate the entire OGJ200 group. Assets of the top 20-totaling $447.7 billion-represent 88.9% of total yearend 2000 assets for all 200 companies.
The top 20 in the previous OGJ200 group combined for 88.6% of total assets. For yearend 1998, the top 20 had 87.4% of total assets, and for yearend 1997, the top 20 had an 83% share of total assets for the group.
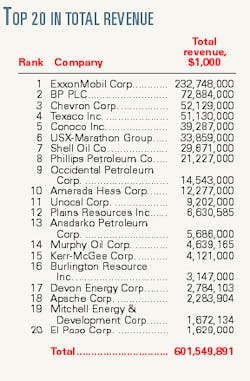
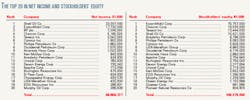
Total revenues of the top 20 increased to $596.1 billion, a 37% jump from last year's top 20 company revenues. Combined profits of the top 20, at $68.7 billion, were up 232%.
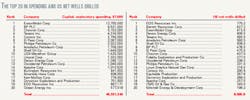
Worldwide capital and exploration expenditures in 2000 by the top 20 group totaled $49.4 billion. This is 82% of the entire OGJ200 group's capital spending in 2000.
With worldwide output of 12.6 tcf, this group of top 20 companies accounted for 79.6% of the natural gas produced by the OGJ200.
The top 20 companies' worldwide liquids production, which includes output of crude, condensate, and natural gas liquids, totaled 2.8 billion bbl, or 90.4% of liquids production for the OGJ200 group. Of this, 1.2 billion bbl were produced in the US.
The top 20 hold 90% of the OGJ200 group's worldwide liquids reserves and 83% of the group's US liquids reserves. They also have 77.7% of the worldwide natural gas reserves and 68.5% of the US natural gas reserves of the group.
The number of net wells drilled in the US during 2000 by the top 20 increased to 7,069. The companies on last year's top 20 list had 4,691 net wells drilled in the US during 1999.
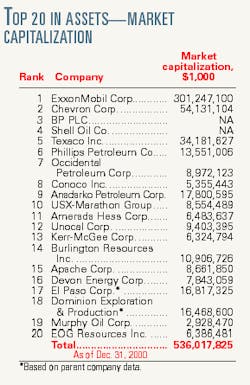
The market capitalization of the top 20 as of Dec. 31, 2000, was $536 billion. This excludes BP, which trades primarily on the London Stock Exchange but also offers American Depository Receipts on the New York Stock Exchange, and Shell, which is a subsidiary of Netherlands and UK-based Royal Dutch/Shell. Included is the market cap of the parent companies of Dominion and El Paso.
Fastest-growing companies
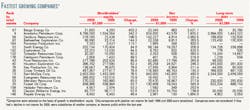
The OGJ200 list of fastest-growing companies ranks organizations based on growth in stockholder equity. For a company to appear on this list, it must have posted positive net income in both 2000 and 1999, and it must have increased its net income last year. Excluded from this list are LPs, newly public companies, and subsidiaries.
Increasing its stockholder equity more than five-fold last year, Houston-based Bargo Energy Co. leads the latest list of fastest growers. Bargo saw its net income surge to $23 million from $663,000 a year earlier, and its long-term debt shrunk to $85,000 from $20.8 million. Bargo ranks at No. 87 on the overall OGJ200 list based on assets, up from No. 110 a year ago.
Bellwether Exploration Co., also based in Houston, was the fourth-fastest grower in terms of stockholder equity last year. Bellwether increased its stockholder equity by 144% and posted net income of $32.2 million, up from $8.8 million in 1999.
On May 16, Bellwether completed a merger with Bargo, naming the new combination Mission Resources Corp.
Anadarko was the second-fastest grower. Anadarko's profits last year improved to $824 million from $42.6 million in 1999.
The only company to appear on the list of 20 fastest-growing companies both this year and last is Key Production Co. Inc., Houston, which increased stockholder equity 80% and quadrupled net income last year following its merger with Columbus Energy Corp.
