Exploring for onshore oil seeps with hyperspectral imaging
Explorationists evaluating remote terrain can now consider using airborne hyperspectral imaging for detecting onshore oil seeps. Previous to this new technology, the spatial and spectral resolution of sensors was too limited for successful detection of onshore oil seeps.
A cooperative R&D project facilitated by The Geosat Committee Inc. documented the spectral characteristics of seeps and associated oil-impacted soils and constructed a spectral library to enable deployment of the application to other geographical areas. This oil-focused spectral library may be the first of its kind in the commercial sector and includes signatures with varying amounts of oil, tar, vegetation, soils, and rock.
This library can be used with other handheld, airborne, and satellite hyperspectral sensors to support exploration and environmental applications. The experience gained and this library support the use of hyperspectral remote sensing for detecting onshore oil seeps and oil-impacted soils globally.
Hyperspectral overview
Airborne hyperspectral imagery is used to map different materials at the surface of the earth based on their spectral characteristics.
Hyperspectral sensors measure the intensity of solar energy reflected from materials over hundreds of wavelengths. They can record visible light (comprised of relatively short wavelengths-blue, green, and red) as well as longer, near-infrared, and short wave-infrared light.
Reflected light is collected into picture elements (pixels) by flying an imaging sensor over terrain. The reflected visible and infrared light is subdivided into 100 to 200+ discrete wavelength bands within each pixel or instantaneous field of view (IFOV). This large number of spectral bands is the basis of the name "hyperspectral," which differs from multispectral sensors that have a handful of spectral bands.1
The amount of energy recorded by the hyperspectral sensor within each pixel varies across the wavelength spectrum because different materials on the earth's surface scatter or absorb solar energy to varying amounts based upon the material's physical properties and composition. Hyperspectral sensors are unique in that they have sufficient spectral resolution to identify different surface materials based solely on spectral signatures.
In order to correlate spectral signatures with specific materials, scientists obtain "pure" samples of the material and collect highly accurate, reflected light measurements in the lab or in the field using a portable spectrometer. The measurements allow spectral libraries to be built that contain various hyperspectral signatures that have been positively identified with specific materials at the earth's surface. Spectral libraries have been constructed for numerous minerals, plants, and manmade materials.
Cooperative R&D
A cooperative R&D study was initiated by HJW Geospatial Inc. (HJW) and The Geosat Committee Inc. (Geosat) in early 2000.
This study was designed to measure with ground and airborne hyperspectral technology different materials associated with onshore oil seeps and oil-impacted soils in southern California.2 The primary objectives of the study were to develop an understanding of the spectral characteristics of oil-impacted soils and seeps3 and to build a spectral library that would make the detection process more rapid and reliable signatures.

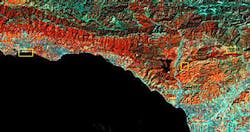
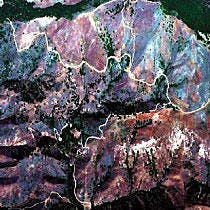
Chevron, Royal Dutch/Shell, and ExxonMobil sponsored the study and provided key feedback and guidance to the research effort. The airborne hyperspectral imagery was acquired by Earth Search Sciences Inc. (ESSI) during a 1998 group shoot over the Santa Barbara, Calif., area (Fig. 1).
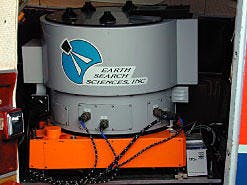
ESSI used a very sophisticated airborne sensor built by Integrated Spectronics that records reflected light energy across a span of ~2200 nanometers (nm) from the visible and near-infrared through short wave-infrared wavelengths (VNIR-SWIR, see Fig. 2). The sensor (designated Probe-1 by ESSI) divides the ~2200 nm span into 128 wavelength intervals or bands.
The hyperspectral data, collected by line-scanner technology, were acquired as flight strips with a 5-m ground sampling distance (gsd). The instrument collects data in a cross-track direction by mechanical scanning and an along-track direction by forward motion of the aircraft. Each flight strip covers 2.5 km across and 25 km long. Each flight strip with its 128 bands or layers of data can be considered a hyperspectral "data cube."
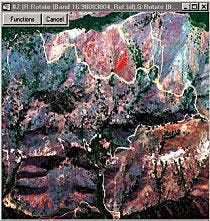
The 1998 group shoot was organized by Geosat and supported by these same sponsors. It was during the 1998 group shoot that HJW discovered evidence that unique hyperspectral signatures could be associated with oil seeps mapped by Thomas Dibblee (Fig. 3). However, there was no field verification of the findings until the 2000 study when HJW sent field crews to the areas of interest with a portable spectrometer, detailed mapping program, and GPS receiver.
Finding an oil seep
The 2000 study focused on portable field spectrometer measurements at three sites: More Mesa, Sulphur Mountain, and Osborne (Fig. 1). In addition, the Probe-1 airborne data cubes were reevaluated using the new field observations and measurements.
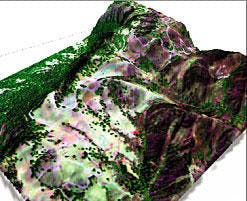
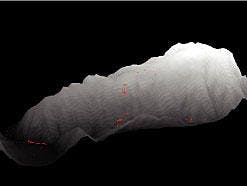
The field sites were determined by Pat Caldwell of HJW based on field experience, State of California Mines and Geology publications (especially Hodgson's 1987 contribution), and the Dibblee Geological Foundation (http://dibblee.geol.ucsb .edu/). Dibblee's geologic maps, along with the hyperspectral imagery, were draped over USGS Digital Elevation Models (DEMs) to facilitate the location of "Dibblee oil seeps" on the flight strips (Fig. 3).
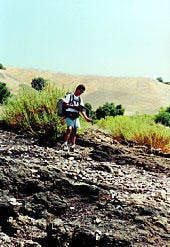
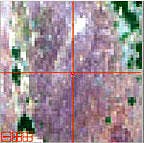
HJW sent an experienced crew into the field during August 2000 with the field spectrometer and GPS receiver to confirm that the airborne spectral signatures found during the 1998 study were caused directly by oil seeps and oil-impacted soils (Fig. 4).
HJW discovered that a very large tar deposit characterized the primary "Dibblee oil seep" at Sulphur Mountain. In addition, there were numerous active oil seeps along the flank of the anticline. There were areas in or near the deposit where vegetation appeared stressed, but there were also areas where vegetation appeared to be vigorous. Botanical observations were collected along with seep samples.
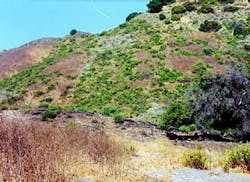
At More Mesa a large oil seep deposit crops out along the ocean beach, while at Osborne numerous seeps and areas of impacted soil were mapped. The same observations and methodology used at Sulphur Mountain were carried out at these two other sites.
Characterizing an oil seep
An Analytical Spectral Devices (ASD) spectrometer capable of measuring VNIR-SWIR spectral response was used to spectrally characterize the oil seeps.

A systematic measurement program was designed for the handheld spectrometer to determine the effect that different mixtures had on hyperspectral. The field crew was able to carefully measure ground surfaces that were composed of a single material or some mixture of materials using the handheld device. In particular, discrete areas were measured that had liquid oil or tar associated with different amounts of vegetation or soil (Table 1).
These data were processed to determine the spectral characteristics of different mixtures and also the difference between impacted and nonimpacted sites.
These ground measurements were used to better understand the spectral signatures being recorded within airborne pixels that cover 25 sq m. Developing an understanding of the effect of mixtures on spectral signatures is essential for properly interpreting the airborne pixels as they are very rarely composed of one material. In addition, these controlled ground measurements were used to build the spectral library so essential for deploying airborne and satellite technology with confidence elsewhere.
The field spectra collected with the ASD, GPS readings, field descriptions, and samples were then compiled and evaluated. The spectral signatures of both the ground and airborne data for similar materials were consistent. The sensor successfully detected the signal from surfaces impacted by oil.
HJW's research indicates that the full spectrum from visible through short wave-infrared light (VNIR-SWIR) needs to be carefully analyzed to differentiate oil-impacted pixels from those that are not impacted. New work processes were developed by HJW analysts with ENVI image processing software to successfully extract this subtle signal from the data cube.
To better understand sites, they "unmixed" the signatures of materials occurring within a pixel, allowing the identification of individual materials as well as providing information on their relative abundance.
The physical properties and composition of soils that were impacted with oil compared with soils that were not impacted were sufficiently different to allow differentiation of these areas by this sophisticated airborne sensor. The sensor's narrow bands and high signal-to-noise characteristics enable this differentiation. However, the sensor can only detect these differences if the hydrocarbon-based material is not excessively masked or too subtle.
Building a spectral library
Hyperspectral sensors are unique in that they have enough spectral resolution to identify individual surface materials based solely on spectral signatures.
At each of the field sites in this study numerous spectra were collected of different materials (Table 1). These individual spectral signatures were archived in ENVI and ASCII format and integrated into a geographical information system (GIS) with global positioning system (GPS) coordinates, ground photographs, field observations, and ancillary data.
To build a robust library, a cost-effective, GPS technology that would ensure 1 to 5-m accuracy for the field sites was needed. Such a level of accuracy would enable other researchers to revisit the oil seep, outcrop, or impacted soil area in the future. It would also provide a consistent level of location accuracy for spectra, samples, and ground photographs in our GIS.
In addition, these ground control points could be used to improve the georectification of the hyperspectral imagery. To achieve the 1 to 5-m accuracy, we used a high-end, handheld GPS receiver, a moderately priced GPS receiver, and post-processed code-phased GPS data. Trimble's on-line mission planning program, SatView, was used to determine satellite availability and expected signal strength for the days the crew was in the field.
While we successfully used the portable spectrometer in our field program to acquire spectral signatures of surfaces covered 100% with oil and tar, we were unable to find pure pixels in the airborne imagery of these field sites.
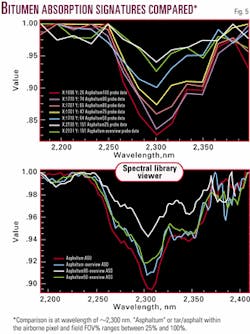
Given the importance of understanding how the airborne sensor records varying amounts of tar, we systematically analyzed an airport runway that had undergone recent repaving with fresh tar-asphalt. We chose pixels within this runway that were visually composed of varying amounts of tar (from 25% to 100%) and compared this gradation to the ASD field data (Fig. 5).
For purposes of this article we focus only on the documented "bitumen" absorption feature that occurs ~2300 nm. The depth of this absorption feature correlates very well to the amount of bitumen (or tar and asphalt) in the field IFOV and airborne pixel (Fig. 5). The similarity between the coarser airborne spectra and the field data is striking and further substantiates using sophisticated VNIR-SWIR sensors for airborne mapping of oil-impacted surfaces.
The spectral library has to be used appropriately for reliable detection of oil-impacted surfaces. In addition, analysts need to understand the environmental conditions into which the library is being applied. Some issues that should be considered include:
- Using only the bitumen absorption feature (Fig. 5) as the sole basis for detection is unreliable. Several zones along the VNIR-SWIR wavelength range need to be evaluated when determining the probability that a pixel has been impacted by oil.
- Using local training sites with known materials at the surface significantly improves the confidence level for detecting oil-impacted surfaces.
- Other researchers have noted a diagnostic feature occurs at 1703 nm. However, this is very close to a major water absorption feature that attenuates much of the signal.
- Calcite and dolomite have a pronounced absorption feature in the same wavelength range as bitumen. However, the shapes of the features are different and need to be differentiated.
- Sensors display some calibration differences when compared with each other. Fig. 5 displays the slight offset between the bitumen absorption feature recorded by the ASD handheld spectrometer and the Probe-1 airborne sensor. This difference has to be understood and integrated into the analysis.
- Many materials in our society can be hydrocarbon-based, including roads, parking lots, and roofs. Plastics and oil stains on surfaces can cause confusion. Depending on the objectives of the study, these materials need to be identified and eliminated from the interpretation.
- Onshore oil-impacted sites are rarely apparent in the various color combinations of original or spectrally compressed bands.
- Pixels with oil-impacted surfaces are usually mixed with other materials and have a weak signal. They rarely show as purer "endmember" pixels, minimizing the value and reliability of some of the more automated processing algorithms.
- The more experience the analysts have processing for the subtle hydrocarbon-based signal, the more reliable the interpretation.
Exploring for other oil seeps
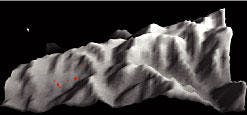
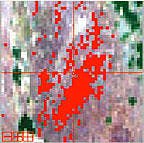
The spectral signature obtained at the primary Dibblee seep (Fig. 4) was extrapolated across the surrounding terrain (see Fig. 6) to determine if other seeps seen in the field could be detected. This conservative extrapolation successfully detected numerous small oil seeps/oil-impacted soils away from the main seep.
An area about 20 km east of the primary Dibblee seep was also analyzed (Fig. 7). This extrapolation clearly shows the technique maps significant oil seep-oil staining in several areas. Field verification of the interpretation is recommended with the results being used to improve the processing for generation of a more reliable map. The location of these impacted sites should be integrated with surface and subsurface structure and stratigraphy, historic and current oil field maps, and topography to better understand the exploration significance of these oil seeps/oil-impacted soils.
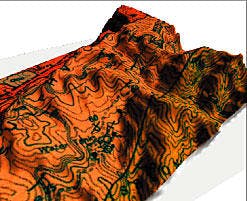
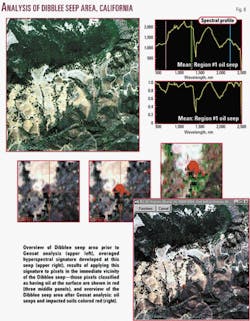
Integrating patterns of oil seeps and impacted soils derived from the hyperspectral imagery with digital elevation models (DEMs) can improve understanding the spatial relationship between oil-impacted surfaces and topography (see Fig. 8). Draping structural and stratigraphic maps over the same DEM (see Fig. 3) enables correlation of surface oil seepage with geology.
The exploration area of interest should be analyzed using a natural color rendering of hyperspectral imagery or some other imagery to eliminate manmade features with hydrocarbon-based material at the surface (asphalt-covered roads or plastics). Some linear features classified as oil-impacted surfaces can be seen along the plunging nose and flank of the anticline shown in Fig. 8B. These features may be sections of road composed of manmade asphalt or partially covered by oil associated with storm runoff.
Multiple applications
This cooperative R&D effort provides fundamental support for deploying hyperspectral imaging to detect onshore oil seeps.
The oil-focused spectral library, combined with appropriate work processes, skill, and experience, will enable earth scientists to begin considering VNIR-SWIR imaging as another tool for improving onshore exploration. This study demonstrates that hyperspectral technology would be an effective tool to better understand the probability of oil seeps across remote geologic structures.5
Detecting oil seeps is a very important but relatively narrow application for hyperspectral imagery. These images are a very rich data set that can be used for many applications that support the exploration effort, including significantly improving surface geologic maps of stratigraphy, lithology, and structure. Indirect indicators of hydrocarbon seepage, such as altered soils (iron oxides, clay, calcite, etc., changes) and stressed vegetation can also be effectively interpreted from hyperspectral imagery.
In addition, while providing primary information to explorationists, hyperspectral data cubes can simultaneously be exploited for fundamental environmental information. This environmental information can include baselines, change detection, and the status of plant communities, vegetation vigor, infrastructure (wells, pipelines, tanks, etc.), water (holding ponds, dredged channels, etc.), local population, and impacted sites.4
Extracting this unique knowledge about the environment from the data cubes significantly reduces the risks associated with acquiring hyperspectral imagery exclusively for exploration as it enables managers to better understand and manage the asset during all stages of development.
Acknowledgments
Dr. Rebecca Dodge of The Geosat Committee Inc. (www.geosatcom.com) coordinated the proposal and funding. This Geosat study was supported by T. Rubin of Chevron Information & Technology Co., San Ramon, Calif., M. Little, H. Yang, and O. Podlaha of Shell International Exploration and Production BV, The Netherlands; and J. Helfand of ExxonMobil, Houston. Patrick Caldwell, formerly of HJW, developed the critical field sites, while Michael Quinn provided GPS expertise and image processing support. Jennifer Gebelien, doctoral candidate at University of California Santa Barbara, provided key field observations with vegetation.
References
- Kruse, F.A, "Visible and Infrared: Sensors and Case Studies," in Rencz, A.N., ed., "Remote Sensing for the Earth Sciences," 3rd ed., Vol. 3., 1999, pp. 567-612.
- van der Meer, F., van Dijk, P., Schetselaar, E., Little, M., Podlaha, O, Yang, H., and Biegert, E., "An integrated geoscience approach for hyperspectral hydrocarbon microseepage detection," proceedings 14th international conference on Applied Geologic Remote Sensing, Las Vegas, Nev., Nov. 6-8, 2000, pp. 81-88.
- Yang, H., Zhang, J., van der Meer, F., and S. Kroonenberg, "Geochemistry and field spectrometry for detecting hydrocarbon microseepage," Terra Nova, Vol. 10, 1999, pp. 231-235.
- Ellis, J.M., Davis, H.H., and Quinn, M.B., "Multiple applications for airborne hyperspectral sensors," 5th international conference on Airborne Remote Sensing, San Francisco, Calif., Sept. 12-14, 2001, 8 p.
- McCoy, R.M., Blake, J.G., and Andrews, K.L., "Detecting hydrocarbon microseepage using hydrocarbon absorption band of reflectance spectra of surface soils," OGJ, May 28, 2001, p. 40.
The authors

James Ellis is director of remote sensing and GIS at HJW GeoSpatial Inc., providing mapping and database solutions to exploration, environmental, engineering, and government clients. He has worked with remote sensing and GIS technologies for 20 years, previously at Gulf Oil Corp. and Chevron Overseas Petroleum Inc. He has a PhD degree in geology from State University of New York at Buffalo. E-mail: [email protected]

Hattie Davis is a remote sensing analyst with HJW GeoSpatial specializing in processing global, remote sensing data sets (satellite, aerial photography, hyperspectral) and integrating these images and derived maps into GIS solutions. She has 12 years experience, previously with Chevron Overseas Petroleum Inc. She has a BS degree from the University of Connecticut. E-mail: [email protected]

Joseph Zamudio is vice president of technological operations at Earth Search Sciences Inc., where he plans and coordinates hyperspectral surveys and develops new preprocessing and analysis methods. He has done research, mapping, and taught workshops on hyperspectral technology during the past 15 years with his primary focus on geologic and environmental applications. He has a PhD degree in geology from the University of Colorado. E-mail: [email protected]