Petrochemical Operations: Ethylene must compete with electricity for natural gas resources
Increased competition between the ethylene and electricity markets for natural gas is one reason North American natural gas prices will remain higher than in the recent past.
Although current cash prices have dropped to less than $3/MMbtu at the Henry Hub, the 2001 year-to-date average price is $5.37/MMbtu. This price is 24% higher than the 2000 average and nearly 60% higher than the 1995-99 average.
For the first time, electricity generation is leading the industrial market as the primary consumer of natural gas in the US. The growth of its share in this market will accelerate at least through the start-up cycle of the current wave of new power-generation capacity, expected to come online through 2003. Most of these new plants will use natural gas as the primary fuel.
This situation presents a major challenge for US industries needing gas as both a feedstock and a fuel. Middle Eastern suppliers using lower cost natural gas and LPG pose a threat to the 16% of US ethylene derivatives production that historically had been sold in the export markets.
North American petchem margins
Higher energy prices, a strong US dollar, and weakening economic conditions have hit the ethylene industry hard. June 2001 capacity utilization for ethylene steam crackers was 75.7% of capacity; the January 2001 utilization was 76.9% when natural gas prices rose to more than $10/MMbtu.
Despite increases in energy prices, some North American olefins producers have advantages of location and scale that will enable them to continue supporting the domestic markets in the future. Although electricity has given the ethylene industry a shock, the impact is not fatal.
The economic recovery originally forecast for the latter half of 2001 looks less robust than originally hoped. In the US, estimates of gross domestic product (GDP) growth for 2001 range from less than 1% to 2%. For 2002, forecasts have been revised downward from 3.4% to as low as 1.2%.
These conditions, together with new capacity coming online in 2001 and 2003, will likely stretch out the margin cycle for the domestic ethylene industry. It may be 2004-05 before capacity utilization approaches the mid-90% level again.
In the meantime, feedstock buyers whose costs are driven by natural gas will need to add another price curve to their charts-the power curve.
Changes in gas demand
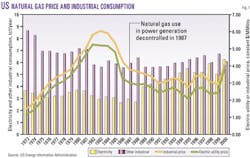
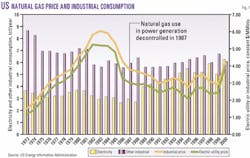
Fig. 1 shows the historical trends in natural gas demand and delivered prices for power generation and other industrial uses. The price gap that historically existed between the power market and other industrial consumers almost closed in 2000.
When US economic growth resumes, gas supplies will likely continue to be tight despite higher levels of drilling. Production declines for new gas wells have almost doubled in recent years, so that it takes almost twice as many wells to produce the same amount of gas.
When supply is tight, the economics of the power market will increasingly set the marginal price of natural gas for industrial users. This has significant implications for the North American petrochemical industry, which up until recently had reaped the cost advantage of being a clearing market for excess btus not consumed in the higher value fuels markets.
What can be considered a normal price level over the next few years will reflect the structural changes in the energy business that have occurred since the beginning of deregulation in the wholesale electricity markets.
A major difference between the latest energy crisis and the 1970s version is the concentration of assets in the hands of energy industry players. The relaxation of regulations forbidding electricity and natural gas utilities to combine has resulted in new businesses whose interests depend on maximizing profit across both business lines.
This integrated power industry is just beginning to make its influence felt as a future growth market for gas. These "convergence" companies, which sell gas as btus or megawatts, are a major force in the US energy markets. They companies rely on vertical integration, trading expertise, and nationwide access to markets to provide margin protection and opportunities for growth.
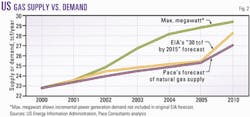
Fig. 2 projects the impact of the growth in gas demand for power on the overall natural gas supply and demand balance during the next 10 years. This graph compares Pace's forecast of natural gas supply to the US government's gas demand forecast and a Pace revised demand forecast, including new power plant projects built or announced as of March 2001.
The "30 tcf by 2015" forecast shown in the chart is the base-case demand forecast originally published by the US Energy Information Administration (EIA) and supported by gas industry trade groups. The "max megawatt" forecast adds Pace's estimate of the potential incremental gas demand for power generation from facilities not included in the original government forecast.
If announced construction proceeds, the potential increased demand from these power plants exceeds 5 tcf/year by 2005, a 22% increase in total natural gas demand from current levels.
Even if all plants announced for start-up in 2004 and beyond are dropped from the list, the forecast increase in gas demand would still be almost 10% greater than the 2000 total US consumption level of 22.7 tcf. Even the most optimistic drillers don't see gas supply growing by this much in the next 2 years.
This graph highlights the reasoning behind Pace's expectation that average natural gas prices in the 2001-03 period will settle higher than those of the past 5 years. Prices will remain higher and more volatile for at least the time that will be required for the power industry to adjust new construction plans to diversify fuel sources away from gas.
Recent announcements of new coal-fired plants indicate this shift may occur, but the time required for site selection, permitting, and construction puts the start-up date for many of these facilities past 2004.
Power buyers changing price
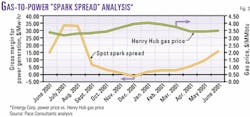
Fig. 3 illustrates the impact of the power market on spot natural gas prices. This graph shows the "spot spark spread" between the price of natural gas at Henry Hub and the current futures price for power in Entergy Corp.'s market area.
This region includes Southeast Texas and a significant portion of the Gulf Coast industrial markets to the east. This spread represents the gross margin that could be locked in by selling power and buying gas at these futures prices. The breakeven gas price line shows the maximum gas price that could be paid by a power marketer covering fuel costs.
This graph shows that the power market still has some reserve buying power in the summer months of 2001 and 2002. The price the power market could pay is still higher than prices that backed out demand from the chemicals industry this winter.
This graph also illustrates how the gas market could begin to have two seasonal peaks: the normal winter heating season spike and an increase during the summer air conditioning months. The change from a "U" to a "W" price curve with two seasonal shoulders will make gas inventory management even more challenging in the future.
Ethane btus vs. barrels
The increasing demand for btus to feed the electricity markets may also collide with the North American petrochemical industry's historical preference for ethane as a feedstock.
About 53% of the ethylene produced in North America is from ethane feedstock. With the exception of a relatively small volume extracted from refinery offgas, most ethane is extracted in gas processing operations.
The gas processing industry stands at the intersection of the "btu vs. barrel" market for natural gas. For the past 15 years, ethane has essentially been a clearing market for surplus btus.
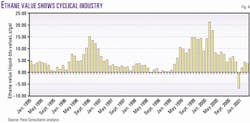
Fig. 4 illustrates the historical value of ethane as a liquid relative to its value as a gas. This chart demonstrates the cyclical nature of the gas processing business, and one of the reasons for the massive consolidation that has occurred within the industry in the past 2 years.
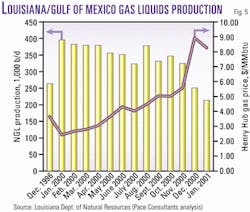
During last winter's rapid rise in gas prices, gas processors tested the limits of their ability to minimize gas liquids recovery. Fig. 5 shows the sensitivity of NGL production to gas prices in Louisiana and the Gulf of Mexico.
This region was widely expected to be a significant source of new feedstock supplies due to increased gas production associated with the large new deepwater reserves brought on production over the past several years.
This chart illustrates that the predictions of increased NGL supply were on target, although total gas production was on average lower than in 1996. The peak increase in Louisiana and Gulf of Mexico NGL production from December 1996 levels was close to the base-case projections generated by both internal and external studies. However, the sensitivity of gas liquids production to gas prices in this region is illustrated by the drop in January 2001 production to less than in December 1996.
Gas plant upgrades will likely include the ability selectively to reject or reinject ethane into the gas stream to optimize btu deliveries against pipeline specifications. Reinjection capability allows producers with differing markets to choose whether their share of the gas going through the plant will be moved as btus or barrels.
Continued consolidation in the gas processing industry may also change the traditional orientation of the business. The top eight operators run almost 66% of Lower 48 gas processing capacity today. Duke Energy Corp. alone controls 14%.
The remaining five in the top eight-operator category are Enterprise Products Partners LP, ExxonMobil Corp., BP PLC, Oneok Gas Processing LLC, and Williams Energy Services.
Although these companies do not own all of this processing capacity outright, in many cases, the plant operator is the business manager for the facility. The plant operator may also contractually be the buyer of last resort when gas suppliers have not made arrangements to move their gas or NGLs out of the facility.
Some of the business units within these companies could have a bias toward keeping NGLs moving through their downstream business units. But the "convergence" companies may have a different goal. They could be expected to have a bias toward the btu market if they need to hedge gas-supply requirements for power plants during tight supply conditions.
The author
Anne Keller is a senior consultant at Pace Consultants Inc., Houston. She joined the company in 2000 and is responsible for market analysis and forecasting in the natural gas, LPG, NGL, and LNG markets. She has previous industry experience with Conoco Inc. and E.I. DuPont de Nemours & Co. in corporate finance and the natural gas and gas liquids operating group. Keller holds a BS in business administration and accounting from Oklahoma State University, Stillwater, and an MBA from the University of Oklahoma, Norman.
