The recent higher prices for oil and gas coupled with a rising awareness of a potential supply shortage indicate exploration will climb in the next few years. Based on historical trends, this should translate into another wave of exploration in the onshore basins of North America.
This prediction is further supported by recent estimates of undiscovered reserves in North America, recoverable with present technology, of 70-100 billion bbl or more. Additional positive incentives include a well-developed surface infrastructure, established markets, low political risk, and mineral leases available at reasonable costs. In addition the virtual abandonment of the onshore areas by most major oil companies has left a competitive vacuum for smaller exploration companies to exploit.
However, most, if not all, of the North American onshore basins are considered to be "mature" due to the significant number of wells drilled in each basin. They are therefore seen as having little significant new potential.
This is due in large part to the fact that the primary exploration tool, subsurface seismic, has been used so extensively over most of the basins in North America that it is perceived that few promising seismic anomalies remain untested. In addition, large portions of these basins are considered to have no structural complexity and have little interest to explorationists.
However, both theory1-7 and observation6-11 have shown that a dense but subtle tectonic framework underlies the entire interiors of cratons, a framework that is responsible for trapping large quantities of hydrocarbons.6 12 13 This framework consists of complexes of vertical faults that have moved episodically throughout geologic time.
Most of these vertical faults are well below seismic resolution both because of their small throw and because they are vertical. We know that these features are ubiquitous; the problem is to detect them. Detection is especially attractive if the methods are of relatively low cost and do not require the development of new technology. In this article we describe such an approach for materially decreasing risk in the exploration for subtle traps.
These faults can be detected and their effects on hydrocarbon accumulation can be assessed through detailed analysis of the large well and production databases that have been compiled over many years of drilling and production in these basins. This small-amplitude background faulting occurs at the same times as the movements of the larger amplitude neighboring structures that have proven to be hydrocarbon traps.
If the larger structures are trapping, then the adjacent similar but smaller structures must also trap their share of hydrocarbons. The undiscovered traps will, in general, be smaller than those associated with the larger structures, but there will be a large number of them and their cumulative effect will be of the same order of magnitude as the reserves found in the larger traps.
Today a case can be made that a campaign involving hundreds of onshore wells can be as, or more, profitable at lower risk than fewer wells drilled in high-risk, deepwater, or frontier locations. That is to say a program designed to discover 50 million bbl of reserves is just as possible in the cratonic interior as elsewhere given that we can detect tectonic features smaller than those exploited heretofore.
Far field tectonics
The procedures discussed below are relevant for any mature highly drilled terrane. They are especially useful for detection of subtle traps located in continental interiors.
A rigid basement, commonly composed of very ancient Precambrian rocks, underlies most of the continental interior. Stresses arising from tectonic events far from the continental interior are efficiently transmitted to the interior.14 15 In the vicinity of major tectonism (the "near" tectonic field) the transmitted stresses can deviate significantly from the horizontal.
However, as we move away from the tectonic front (a few tens of miles) the stresses become horizontal, and it is this horizontal "push" that is transmitted to the continental interior. It is this "far-field," mild "wrench tectonics" that produces the subtle, largely "subseismic" fault-bounded blocks.6
These faults:
- Can act as reservoir seals or flow baffles;
- Can localize stratigraphic traps if they are active during sedimentation;
- Can create locally enhanced permeability by fracturing and microfracturing; or
- Provide conduits for episodic releases of fluids from below which create dissolution porosity in carbonates.
These multiple mechanisms coupled with the compartmentalization associated with a faulted complex provide the opportunity for multiple completions.
Detecting far field structure
Detection of this subdued faulted complex is possible through analysis of the large amounts of data generated in mature petroleum provinces.
Stratigraphic data, especially formation tops, taken from wireline logs have far greater vertical precision than current seismic technology and so have the potential to achieve the desired resolution. This analysis must be performed simultaneously over the entire ensemble of wells and tops.
Other crucial information concerning volumes and properties of produced fluids is also available in mature basins. These sorts of data can be systematically combined with the tops-based three-dimensional data matrix to greatly increase our understanding of the relevance of the newly resolved structural features. This may include properties of produced fluids (density, composition, viscosity, etc.), drillstem test analyses, production rates and volumes, and, of course, geophysical data.
A solution that is consistent with many types of data has the greatest chance of deeper understanding of the nuances of the petroleum system in a basinal setting.
Resolution and proper identification of subtle traps requires marshalling of all available resources, the integration of a multivariate data set. Such features will be expressed on structure contour maps as one or more small "wiggles"-deviations from a general trend.
These small departures may express the presence of a structure or may be the result of data errors, such as incorrect surface elevations, or an artifact of the contouring process. Even if real, no strong information is available from a single stratigraphic surface indicating whether the subtle feature represents a fold or a fault. In addition, stratigraphic tops are defined by visual interpretation of log traces and are subject to differences of opinion as well as outright errors.
In order to utilize these data we must first clear the data of errors or inconsistencies. Comparing these patterns through the entire stratigraphic sequence and associating the patterns with engineering and production data can provide the evidence needed to correctly identify and classify subtle features. When the subtle feature is observed consistently through the sediments, even in formations of no interest, its validity as a vertically discrete structure is enhanced.
To detect these subtle features a variety of data processing and analytical procedures has recently been encapsulated in a methodology termed "petroleum data mining." The objective of this subdiscipline of data mining is to take advantage of the vast amounts of data now available in order to resolve the underlying spatial patterns and relate them to other variables such as production statistics.
One of the attractive aspects of "mining" the legacy data is the low cost compared to any other exploration approach. Because the database contains extensive and detailed production data, the data mining exploration effort can produce a quantified risk and economic evaluation. For example, a prudent onshore strategy can be guided by the economics of finding and production costs: parameters that are easily quantified in mature basins.
The risk that accompanies a given play concept can be easily quantified. The smaller, less risky opportunities located at more heavily explored, shallower intervals can be used to help pay for riskier but potentially more profitable exploration into the deeper portions of a basin.
The object of the data mining approach is ultimately to produce large numbers of high quality leads and prospects as well as helping develop new exploration play concepts. The effort must constitute a relatively small share of the exploration budget as a means to reducing finding costs. Speed is essential in order to take advantage of opportunities in terms of open leases, expiring leases, or the acquisition of producing properties. Petroleum data mining thus must have the three advantages of accuracy, economy, and speed.
Within that framework, our experience indicates that the exercise should have as many as six distinct parts:
- Database construction.
- Data screening and refining.
- Resolution of subtle structures.
- Determining the timing of structural movement that localizes stratigraphic traps.
- Relating structural features to production data and to material properties (fluids, chemistry, etc.).
- Documentation of plays and leads using the integrated results. Play and lead formulation involves not only identifying promising drilling locations but also providing the data for determining the risk and economic parameters necessary for evaluation and ranking purposes.
Explorationists have always used much of this same information in defining play concepts, leads, and prospects but not at the scale discussed in this article. The conventional approach seldom employs a systematic analysis of large datasets containing essentially all of the available data:
- Geological.
- Engineering (including petrophysical data and drillstem tests).
- Production (including chemical analyses and rates of produced fluids).
- Geophysical (including potential fields in addition to seismic data).
For most of North America, rich digital databases exist in the public domain or can be purchased from data vendors. Vast amounts of well-organized hard copy data exist and can be rapidly put into relational databases. Datasets that contain information from more than 20,000 wells can now be obtained easily in most areas. This sort of data-mining exploration program is extremely cost-effective compared to conventional labor-intensive geological workups or seismic-based programs.
Data screening
In our experience, all datasets contain errors that arise from incorrect data entry, lack of correction to true vertical thickness, insertion of a wrong value for the elevation of the kelly bushing, etc. Another source of unwanted variability is bias in picking a stratigraphic top by two or more specialists.
Except for this last point, our experience is that up to 5% of the tops at any horizon are erroneous. This in the past has deterred widespread use of such data. Therefore efficient data cleaning procedures must be employed to clear the data of man-made errors or reduce the influence of such errors. These have been developed in the past few years. The major data cleaning effort for 20,000 wells each penetrating 30 formation tops can be accomplished in less than a week.
In our experience the initial cleaning procedures identify most of the errors. However, error checking is a continuous process and a few additional errors are commonly found during data analysis. In our experience this data cleaning must be performed mostly in a nongraphic, analytical mode. Subjective visual inspection of hundreds or thousands of maps is not time effective or efficient and in most cases is virtually impossible.
Spatial scale
Analyzing a large amount of cleaned data allows regional scale analysis but preserves local, field-scale resolution.
In some cases, a few tens of wells are analyzed over a restricted area of interest, but often, subtle features that may be resolvable at larger scale may be poorly resolved over a small area due to lack of local control.
The highest number of wells that we have processed in a single investigation is about 54,000 covering an area of more than 100,000 sq miles. The smallest number was six wells arrayed in a spatial pattern that was ill-arranged for contouring but carried important information when analyzed first in the frequency domain.
Other analyses
An ensemble of structural surfaces must be analyzed simultaneously so that the consistency and nature of features can be assessed through the entire sequence penetrated. Our experience suggests that much of this analysis can be done more accurately and quickly in the "frequency domain" rather than in the graphics-intensive (largely subjective) spatial domain.
Frequency domain analysis does not depend on the selection of gridding or interpolation schemes required in conventional map analysis. The final products are, of course, maps and cross-sections, but the choice of mapping parameters is closely constrained by the prior analysis in the frequency domain.
The degree of structural congruency between formations is a strong indication of the validity of a subtle feature observed faintly at the level of the target formation. We can commonly (given a decent spatial array) locate the existence and azimuth of faults with vertical displacements of 10 ft or more. We can sometimes detect faults with throws less than that in densely drilled oil fields.
A future article will discuss this application at the reservoir scale for development planning, enhanced recovery operations, and geostatistic evaluations.
This congruent method can also resolve the fault versus fold question and provide more precise information concerning its true geometry and areal extent because structures propagate in well-known patterns under both conditions of both brittle and plastic deformation.
Structural history analysis
Detection of abrupt changes in formation thickness is a complementary method for detecting faults active during sedimentation. Integrated through the sequence, this also defines the times of the fault activity.
Conventionally this is achieved by analysis of cross-sections and isopachous maps. Setting aside the possibility for subjective biases in their construction and interpretation, this sort of hands-on procedure is prohibitively time consuming when areas of tens to thousands of square miles must be assessed.
Structural history analysis is designed to detect such interactions quickly and precisely. This is achieved by including all tops in a single analysis. The output defines stratigraphic bundles with a common history. Commonly, bundles are mutually separated by unconformities. Within a bundle, the active and passive regions, commonly fault bounded, are identified analytically. Structures may become more or less accentuated from one time to the next and even be inverted.
Structural history analysis generally shows that a fundamental unit in reactivation is a fault-bounded mosaic element (a "domain"); a polygonal area of 25-500 or more sq miles. The pattern of internal disruption of an element seems to change from element to element. The faults bounding these larger blocks form a larger-scale framework within which smaller faults and folds can occur. These large-scale features are relatively easy (as shown below) to correlate with patterns on aeromagnetic maps. This cross-referencing permits use of aeromagnetic data to extrapolate structures into areas of low well control.
Example: Williston basin
The Williston basin is a typical intracratonic basin widely considered to be rather featureless, apart from two or three well-known structures.
The basin occupies 110,000 sq miles of North and South Dakota, Montana, Saskatchewan, and Manitoba. Up to 16,000 ft of Phanerozoic sediments are preserved in the central part of the basin. These rocks have always been in the zone of brittle deformation (in terms of their strength, their historically relatively low temperature-low pressure environment, and the low stress history).
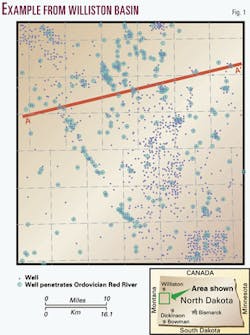
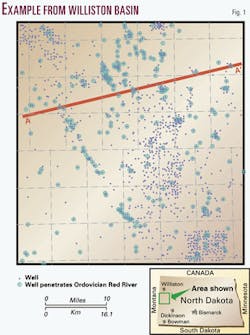
Two prominent structures, the Nesson and Cedar Creek anticlines, account for most of the production. Although many oil field descriptions mention a subtle structural influence, it is commonly believed that most traps away from the anticlines are dominantly stratigraphic. An area of about 1,500 sq miles west of the Nesson anticline (Fig. 1) was chosen to illustrate the points discussed above.
This area contains about 1,100 wells. A well may penetrate as many as 20 stratigraphic tops ranging in age from Ordovician to Cretaceous. Most wells have penetrated Mississippian and younger strata. For our purposes, we define the relatively sparsely drilled (267 wells) Ordovician Red River formation as the zone of interest.
The aeromagnetic data consist of a series of east-west flight lines flown 3,000 ft apart. Each flight line produces a densely sampled aeromagnetic profile. Residuals were calculated using a proprietary procedure, and then a map of residuals was plotted. Just as with well-based data, proper processing, screening, and interpolation of aeromagnetic data are crucial for high-resolution interpretation.
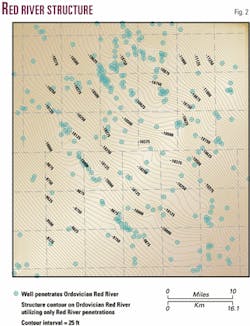
Red River exploration has been largely seismic-driven. We assume that most higher amplitude structures (greater than 100 ft) have been detected and drilled. Given the low density of well penetrations, the structure-contour map drawn on the top Ordovician formation (Fig. 2) displays a few gentle local perturbations from the regional trend and so supports the common misconception that most of the basin is relatively featureless, consisting in the main of rather subdued gentle folds.
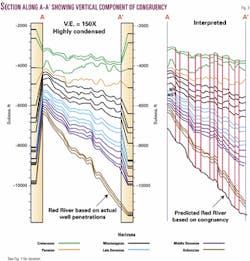
The history and congruency analyses are performed independently. The history analysis defines the activity of faults that affect sedimentation; faults that were active during sedimentation at some time(s) from Ordovician through the Upper Cretaceous. The congruency analysis defines such faults plus those formed after the Upper Cretaceous. These later faults are important factors in many of the traps in this area. As illustrated in the cross-section (Fig. 3), most of the faults are small (<20 ft). They propagate vertically with no significant change in size or location (in map view, allowing for variations in well control), indicating that the structures are actually vertical faults rather than folds.
Concurrently and independently, aeromagnetic data were processed and a map constructed of magnetic residuals. The aeromagnetic patterns are strongly influenced by compositional and structural effects rooted in the Precambrian crust. The major challenge is to identify the features in the aeromagnetic data associated with structures affecting the overlying Phanerozoic sequence while at the same time eliminating features associated only with the Precambrian crust. Comparing the tops-based data with the aeromagnetic data accomplished this.
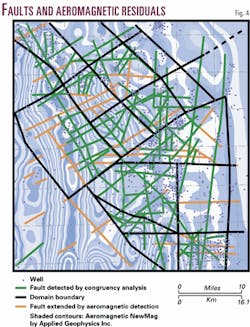
History analysis resolves the large-scale fault-bounded structural mosaic of rectangular to triangular domains (Fig. 4) each with sides several miles long. The blocks have intermittently moved during the Paleozoic. History analysis shows little differential movement of the blocks in the Jurassic but does indicate movements in the Cretaceous.
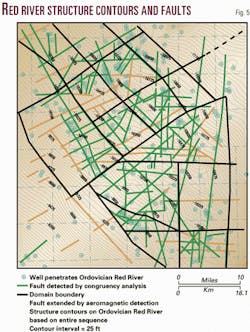
Congruency analysis identifies the same faults as history analysis plus those whose major movements occurred after deposition of the Greenhorn formation (green lines on Fig. 5). Most of the other faults were also involved in this late-stage activity, but the faults marked in green on Fig. 5 moved only after Greenhorn deposition.
The fault-bounded domains defined from history analysis are easily recognized on the aeromagnetic map (Fig. 4). These domains therefore represent fundamental crustal contrasts involving Precambrian basement. The magnetic fabric within a domain (delineated by faults marked with heavy black lines) changes from one domain to another.
Such changes in aeromagnetic signatures are commonly related to compositional differences in the crystalline basement underlying the sedimentary section. This suggests that the domains may represent density contrasts that make each block behave slightly differently in a changing stress field.
The implications concerning the coupling of sedimentation and structure in the sedimentary sequence of compositionally different crustal blocks are discussed in detail by Reiter.5 A strong association between the spatial "footprint" of many intracratonic oil and gas fields and aeromagnetic anomalies has been observed by Gay12 13 in accordance with the physical models of Reiter.5 Using the areas of denser well control for "ground truth," faults can be extrapolated away from control (brown lines, Fig. 5) using the magnetic residuals to parts of the area with sparser well control.
The net effect of the entire analysis is to delineate numerous undrilled compartments in the upper, more densely drilled reservoirs as well as creating numerous leads in the deeper more sparsely drilled Ordovician.
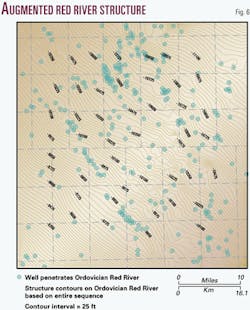
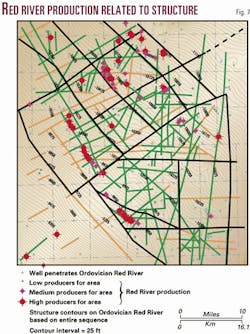
The relatively featureless structure contour map for the Red River (Fig. 2) can be augmented by congruency analysis (Fig. 6, Fig. 3). The fault boundaries detected from the combined congruency, history and aeromagnetic analyses are superimposed in Fig. 6. Inspection of the spatial patterns of the wells classified by production (Fig. 7) help establish the importance of fault proximity to significant production (large red circles). This figure (rendered at a larger scale) is used for generation of leads.
Succeeding seismic
Seismic-based exploration has been successful enough in North America that progressively fewer prospects can be defined seismically. The end of onshore and shallow-water exploration can be forestalled by exploring for traps that escape detection seismically or are so indistinct seismically that supporting evidence is needed.
New, economically viable seismic procedures may in fact be developed in the future. However, these are not available now. "Mining" the rich databases now available in most mature petroleum provinces can provide the higher precision necessary for finding additional reserves at relatively low cost. A key in this endeavor is to take advantage of the mass of data and to analyze that data over large areas and more stratigraphic intervals than the original target location and horizon.
Technology has provided the necessary hardware and software to accomplish this rapidly and at relatively low cost. We have found that these efficiencies are relevant to rapid production of high quality leads.
The products of congruency analysis and history analysis coupled with the production and engineering data are sufficient to efficiently produce leads. However, in the final analysis, prospect generation still requires experience-based mature judgment that may never be entirely supplanted by digital technology. The purpose of such technology is to provide the decisionmaker with the needed information as quickly and efficiently as possible.
The ability to identify faults or fault swarms at deeper sparsely drilled intervals may result in important new leads. Not only can new compartments be outlined as discussed above but also drilling near or through these fault zones may enhance productivity. This can help open up significant reserves by tapping deep or ultradeep (below 25,000 ft) formations. Often at these depths pervasive gas exists, so permeability, rather than structure, traps, or water levels, becomes the significant exploration factor.
Acknowledgments
Kristin Campbell (Residuum) and Ben Opfermann (Applied Geophysics) are responsible for generating the illustrations and processing much of the data. We also are grateful to R.E. Wyman (Dyloc Exploration) for his careful review of the manuscript.
References
- Secor, D.T., "Role of Fluid Pressure in Jointing," Am. Jour. Sci., Vol. 263, 1965, pp. 633-646.
- Pollard, D.D., "On the form and stability of open fractures in the earth's crust," Geophys. Res. Letters, Vol. 3, 1976, pp. 513-516
- Pollard, D.D., and Holzhauzen, G., "On the Mechanical Interactions Between a Fluid-Filled Hydraulic Fracture and the Earth's Surface," Tectonophysics, Vol. 53, 1979, pp. 27-57.
- Stel, H., Cloetingh, S. and van der Beek, P., "Anorogenic granites, magmatic underplating, and the origin of intracratonic basins in a nonextensional setting," Tectono- physics, Vol. 226 (1-4), 1993, pp. 285-299.
- Reiter, M., "Buoyancy tectonic models of uplift and subsidence along high-angle faults in extensional and compressional tectonic regimes," Tectonophysics, Vol. 246 (1-3) , 1995, pp. 71-95.
- Zolnai, G., "Continental Wrench-Tectonics and Hydrocarbon Habitat," AAPG Cont. Ed. Course notes (2nd ed. revised) #30, 1991.
- Baer, G., "Mechanisms of dike propagation in layered rocks and in massive porous sedimentary rocks," J. Geophys. Res., Vol. 96, 1991, pp. 11,911-929.
- Cox, W.F., "Faulting Processes at High Fluid Pressures: an Example of Fault Valve Behavior from the Wattle Gully Fault, Victoria, Australia," J. Geophys. Res., Vol. 100, No. B7, 1995, pp. 12,847-859.
- Prouty, C.E., "Implications of Imagery Studies to Time and Origin of Michigan Basin Linear Structures," AAPG Bull., Vol. 60, 1976, p. 709.
- Hart, B., and Plint, A., "Tectonic Influence on Deposition and Erosion in a Ramp Setting: Upper Cretaceous Cardium Formation, Alberta foreland Basin," AAPG Bull., Vol. 77, No. 12, 1993, pp. 2,092-2,107.
- Powley, D.E., "Pressures And Hydrogeology in Petroleum Basins," Earth-Science Reviews, Vol. 29, 1990, pp. 215-226.
- Gay, S.P., "The Basement Fault-Block Pattern: Its Importance in Petroleum Exploration. And Its Delineation with Residual Aeromagnetic Techniques," in Proceedings of the tenth annual Basement Tectonics conference, Ojakangas, R.W., ed., Kluewer Academic Publishers, Dordrecht, 1995, 443 p.
- Gay, S.P, "Basement Control of Oil and Gas Traps: More Common Than We Thought?," AAPG Bull., Vol. 79, 1995, abs., p. 918.
- Cloetingh, S., "Intraplate Stresses: A new Tectonic Mechanism for Fluctuations in Relative Sea Level," Geology, Vol. 14, 1986, pp. 103-117.
- Cloetingh, S., Tankard, A.J., Welsink, H., and Jenkins, H., "Vail's Coastal Onlap Curves and Their Correlation with Tectonic Events, Offshore Canada," AAPG Memoir 46, 1989, pp. 283-293.
The authors
Dr. Robert Ehrlich has been applying numerical procedures to geological problems for more than 30 years. His specialties include rock-physics interactions, exploratory data analysis, and self-training classifiers. He is vice-president of Residuum Energy. E-mail: [email protected]
Michael J. Dropkin is a geologist who specializes in spatial analysis of geological data. He is responsible for many of the algorithms used in this research. He is chief of operations at Residuum Energy. E-mail: [email protected]
Neal J. Broussard Jr., president of Residuum Energy, has more than 20 years' experience in reservoir engineering, risk analysis, and engineering management. He earned undergraduate and master's degrees in petroleum engineering at Texas A&M University. E-mail: [email protected]
S. Parker Gay has more than 30 years' experience in the acquisition and analysis of aeromagnetic data. He has a long history of relating the locations of oil and gas fields to aeromagnetic residuals. He is a major contributor to the understanding of the structure of the Precambrian basement of North America. He is president of Applied Geophysics Inc. and a graduate of MIT. E-mail: [email protected]
