Andersen: E&P spending to keep climbing in US, Canada
Exploration and development drilling activity in the US and Canada likely will continue increasing into 2002, barring a large drop in commodity oil and gas prices for an extended period, said executives at Andersen-the industry consulting firm formerly known as Arthur Andersen.
Major and independent oil and natural gas producers show "a renewed interest in exploration and production investments in North America," Victor Burk, Andersen managing partner for the energy and utilities industry, told reporters during a news conference upon releasing Andersen's annual report on global exploration and production trends late last month.
US, Canada spending
According to the 155 publicly traded producers that responded to the survey, the US and Canada accounted for 44% of all exploration and development spending last year, up from 34% in 1999, he said.
Accelerated drilling activity in the two countries "is testing the capacity of the contract drilling and oil field services sectors in terms of availability of equipment and people, resulting in increased prices," Burk said.
"Services are rising across the board, but it depends somewhat on the region how much, such as deepwater Gulf of Mexico vs. shallow-water," he said, adding that expenses for items such as seismic surveys have probably not increased as sharply as rig rates.
Meanwhile, he said, "Mergers and acquisitions will continue to be a strategy for many companies to create value, increase production and reserves, and achieve cost savings. But the dollars spent on proved property acquisitions will decline relative to the 'megadeals' of 1999-2000."
The biggest increase in US upstream capital spending last year was for proved property acquisitions, which jumped 256% to $27.8 billion-"almost matching exploration and development spending for the first time," Burk reported.
Large transactions by BP PLC, Phillips Petroleum Co., Occidental Petroleum Corp., and Anadarko Petroleum Corp. accounted for three-quarters of that acquisition activity, he said.
Acquisitions of proved properties in Canada also increased, by 58% to a total value of $6 billion last year, while in the rest of the world, the value of proved property acquisitions declined by 51%.
Spending breakdowns
The surveyed companies posted a combined record after-tax profit of $89 billion from their total exploration and production activities last year. That represented a 125% increase in earnings on a 63% rise in revenues to a total $271 billion, Burk said.
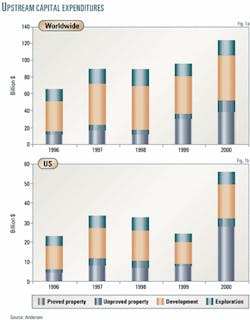
Their total capital spending for exploration, development, and acquisitions of proved properties worldwide increased 30% to $124 billion last year (Fig. 1a).
"But that overall number conceals interesting regional trends," said Burk.
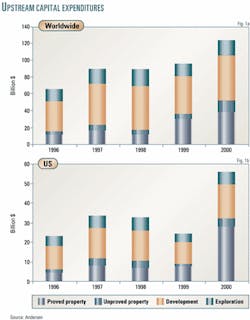
Upstream capital spending increased most in the US, up 132% to $55.8 billion last year, he said (Fig. 1b). Canadian capital expenditures were up 69%, "presumably driven by natural gas drilling," Burk said.
The 155 companies combined reported that their US and Canadian upstream capital spending jumped 116%, compared with a 14% decline in their upstream capital spending elsewhere, he reported.
Total E&D spending by the surveyed companies increased 24% around the globe last year. High commodity prices boosted E&D spending by 72% in the US and 77% in Canada. Such spending in the rest of the world was essentially flat, up only 1%, Burk said.
Nevertheless, he said, "Last year was the first in the past 5 in which US exploration and development spending fell below 50% of the companies' pretax operating cash flow."
US E&D spending amounted to 44% of total pretax operating cash flow among the surveyed companies last year, down from more than 100% in 1998. E&D spending in other countries averaged 52% of the companies' 2000 pretax operating cash flow.
Spending by region
Capital spending by the group for E&D increased in the US, Canada, and the Asia-Pacific region, while Latin America, Europe, Africa, and the Middle East saw decreases in capital expenditures in 2000.
In Canada, all categories of upstream spending increased in 2000. Total capital expenditures jumped to $14.2 billion in 2000 from $8.4 billion in 1999, the report said.
Canadian oil reserves increased 8% to 4.1 billion bbl in 2000 from 3.8 billion bbl in 1999. Oil reserves have increased 58% during the 5-year survey period.
Canadian gas reserves climbed 12% to 28.7 tcf in 2000 from 25.6 tcf in 1999.
Meanwhile, in Latin America, total capital outlays decreased by 57% to $6.3 billion in 2000 from $14.5 billion in 1999.
Yearend Latin American oil reserves increased slightly to 11.8 billion bbl in 2000 compared with 11.5 billion bbl in 1999. Yearend gas reserves remained relatively flat at 23.4 tcf in 2000 compared with 23.3 tcf in 1999.
European capital spending decreased 10% to $13.8 billion in 2000 from $15.4 billion in 1999. Yearend oil reserves decreased 4% to 10.5 billion bbl in 2000 from 10.8 billion bbl in 1999.
Africa and Middle East total capital expenditures decreased 21% to $4.5 billion in 2000 from $5.7 billion in 1999. Yearend oil reserves increased 11% to 10.3 billion bbl in 2000 from 9.3 billion bbl in 1999.
Asia-Pacific capital expenditures in- creased 8% to $9.4 billion in 2000 from $8.7 billion in 1999. The most significant change was in development costs, which increased 17% to $6.8 billion in 2000 from $5.9 billion in 1999. Oil reserves increased 1% to 17.2 billion bbl in 2000 from 17 billion bbl in 1999. Gas reserves increased 14% to 64.6 tcf in 2000 from 56.9 tcf in 1999.
Reserves highest since 1996
The increase in E&D activity since the last half of 1999 has produced the highest reserve levels for the group, both in the US and worldwide, since 1996, said Burk.
Oil reserves last year increased 7% worldwide and 19% in the US. Natural gas reserves were up 9% worldwide and 18% in the US.
"For only the second time in 5 years, survey companies replaced more than 100% of their US production through the drillbit-130% of oil production and 128% of gas production," said Burk. In 1997, the surveyed companies replaced 121% of their US oil production and 109% of their US gas production.
Last year, the surveyed companies replaced through the drillbit 96% of their oil production and 133% of their gas production around the globe. From all sources, that replacement rate was 186% for oil and 223% for gas.
"Upstream investment performance measures improved in every measure in the US but deteriorated on all but one measure worldwide. Nevertheless, the cost to find and develop reserves outside the US remained lower than in the US," Burk said.
Despite increased activity, Burk said he sees none of the "excessive and speculative spending" that normally marks a boom-and-bust cycle within the industry. Instead, he sees the industry "reacting vigorously and efficiently" to changes and opportunities within the oil and natural gas markets.
"Although we can be virtually certain these trends do not signal the beginning of a period of predictability in energy markets," Burk said, "we can see signs that companies are positioning themselves better to manage successfully and sustainably through the cycles."
Companies rely on a wide range of strategies to manage volatile price cycles, he said. These strategies include the use of risk management tools such as hedging, along with making acquisitions targeted toward enhancing strategic options, focusing on cost management tactics, and effective use of technology, he said.
Although natural gas prices have fallen in recent months, Burk said gas prices are "still very strong compared with the average for the last several years."
Companies are making investment decisions today based on conservative estimates for oil and gas prices, he said, adding that companies are unlikely to revise spending plans for the rest of this year or for 2002 unless gas prices were to drop significantly from current levels.
"If prices dropped below $2.50/Mcf, some companies might change their capital spending plans," Burk said of gas futures prices. "I don't think we're going to see that anytime soon, unless there is a severe slowdown in the economy."
During 2000, BP Amoco PLC (now BP PLC) led individual-company total E&P capital spending worldwide with $23.2 billion, followed by Anadarko, $8.5 billion; Phillips, $7.4 billion; ExxonMobil Corp., $6.1 billion; and PetroChina Co. Ltd., $4.7 billion.
BP made the largest US exploration expenditures in 2000, spending $676 million. Chevron Corp. followed with $432 million; Anadarko, $353 million; and Royal Dutch/Shell, $305 million.
The companies surveyed for the Andersen report each have proved oil and gas reserves in excess of 5 million boe. Those companies account for an estimated 87% of total US reserves of oil and natural gas liquids, as well as 68% of total US natural gas reserves.
The group includes 34 companies headquartered outside the US and, for the first time, it also includes three publicly traded Chinese oil companies that only a few years ago were state-owned, Burk said.

