Refinery-profitability statistics begin
This issue of Oil & Gas Journal introduces Muse, Stancil & Co.'s monthly refining margins in the statistics secion. This series will provide insight into the relative profitability of operations in six major refining centers: the US Gulf Coast, US East Coast, US Midwest, US West Coast, Northwest Europe, and Southeast Asia.
Based in Dallas, Muse is an international consulting firm with expertise in economic and strategic issues in the downstream energy industry.
The refinery profitability series is an analysis of profit margins for operations based on current prices and Muse's estimates of typical feedstock and product slates and operating costs for each region.
This article explains the methodology used by Muse to estimate refinery profitability and covers historical refining industry trends. Monthly margins starting in January 1995 and running to date are accessible through the Oil & Gas Journal Energy Database.
As significant changes occur in the industry environment, such as the implementation of new product specifications, changes in process capabilities, or other industry dynamics, Muse will revise the methodology to reflect the impact on refinery margins.
Refinery profitability
The profitability of individual refineries depends on numerous factors. These include:
- The availability and prices for crude oil and other raw material inputs.
- The characteristics of the regional markets in which a refinery operates and sells its products.
- Refinery process capacity, complexity, and efficiency.
- The structure and nature of the refinery's owners.
Muse's refinery profitability series estimates the overall economic performance of refinery manufacturing assets. It also provides insight into the average trends in each region based on the configuration and crude processing capabilities that define the market.
As such, it focuses on the production of refined fuels products by the major refineries in each analyzed region. The analysis encompasses the overall feedstock input and refined products output balance and all cash costs incurred in a refinery's operation.
The analysis is not intended to measure the profitability of incremental refining capacity nor is it intended to reflect the performance of any specific company or refinery.
Muse's refinery profitability series excludes consideration of lube oil, petrochemical, or other specialty products' manufacturing operations. While such operations are carried out at many refineries (and often provide significant contributions to economic performance), they are frequently integrated with other business activities or markets that do not reflect fundamental fuels refining dynamics.
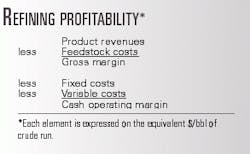
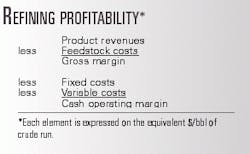
Muse's portrayal of refinery profitability is developed in accordance with the pro forma economic formulas shown in the accompanying box.
The cash-operating margin thus developed is an indicator of the earnings before interest, taxes (income), depreciation, and amortization (EBITDA) that are achieved in various regions over time.
Prices, costs
Muse estimates the product revenue and feedstock cost elements of the cash-operating margin based on prevailing spot prices in each of the regions.
The use of spot prices excludes economic contributions from crude oil production or refined products marketing assets and operations. While such assets and operations contribute to the overall economic performance of many companies, companies often provide separate accounting for the performance of refinery manufacturing assets.
Muse uses a variety of published sources to track crude oil and refined products prices in each refining region. The published refinery profitability series does not include any proprietary or confidential pricing information from individual companies.
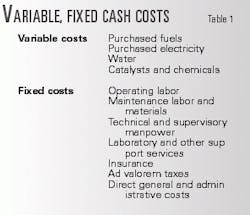
The Muse refinery profitability series reflects estimates of the average cash costs directly associated with each of the regional refinery operations analyzed. As Table 1 shows, the cost structures include both variable and fixed costs.
The Muse refinery cost structures specifically exclude consideration of all indirect and noncash costs such as depreciation, corporate allocations, and financial charges.
Regional refinery capabilities
The refinery profitability series is based on the performance of refineries that are characteristic of the major operations in the regional refining centers addressed.
Muse uses a representative refinery model for each region to develop feedstock and product balances on a seasonal basis. The regional model reflects the average size and complexity of refinery processes employed, a feedstock input mix that is typical of the region, and a slate of refined fuels products that reflects actual regional production patterns and quality specifications.
Small, specialty refineries have not been included in the calculation of the regional average process configurations.
Table 2 summarizes the capacity and major refinery conversion processes employed in each refining region in the Muse refinery-profitability series.
In addition to the major conversion processes noted above, each regional refinery model includes upgrading processes and support facilities needed to produce its slate of refined products.
Additional refining processes include hydrodesulfurization, catalytic reforming, alkylation, and sulfur recovery. Support facilities include typical refinery fuel treating and distribution, steam generation, electric power distribution, cooling water and process water systems, blending facilities, and logistics facilities needed to receive, store, or ship feedstocks, intermediates, and finished products.
The model also assumes that each refinery employs the appropriate environmental control facilities for air emissions, wastewater discharges, and hazardous waste management as required by the region in which it operates.
Crude slates
Muse characterized the crude oils included in the raw-material costs through an analysis of international crude trading patterns, domestic production and shipment profiles, and, where available, the reported average gravity and sulfur content of crude oils processed at refineries in each region.
Regional crude oil input slates reflect blends of widely traded crude streams for which reliable pricing is available. Crude oils not specifically included in the Muse's regional average crude blends will tend to be priced at refining parity with the major market benchmark streams.
Table 3 lists the API gravities and sulfur contents of the 1999 regional average crude oil blends analyzed by Muse.
The feedstock cost estimated for US East Coast refineries in the Muse refinery-profitability series reflects the costs of imported light sweet crude oils from Africa and the North Sea that dominate that region's supply mix.
Midwest refinery models are based on the typical use of a mix of domestic US, Canadian, and other imported crude oils.
The crude oil mix for the US Gulf Coast region consists of supplies from a wide range of sources, including domestic onshore and offshore production, heavy crudes from Venezuela and Mexico, and medium-to-light crudes from Mideast and North Sea sources.
The models show that West Coast refineries primarily consume Alaskan North Slope and California onshore and offshore crudes.
Crude oils processed in Northwest Europe reflect a combination of generally light and sweet supplies from the North Sea and Africa, and medium gravity, high-sulfur crudes from Russia and the Middle East. Crude oils run in Southeast Asia refineries mainly come from a combination of regional production sources (for example, Indonesia, Malaysia, and China) and Middle East streams.
The combination of crude oil availability, crude oil logistics, and refinery configurations contribute to the significant differences in the crude oil qualities (and resulting crude oil costs) associated with the various regional refinery profiles noted above. These same parameters also create differences in the operating costs associated with each region's overall refinery manufacturing base.
Refining trends
The downstream segment of the petroleum industry worldwide has undergone significant changes during the past decade. These changes have affected all aspects of the refining business, including crude oil supply and product-consumption patterns, environmental compliance requirements for refinery operations and major refined products, and the overall competitive business environment.
The transparency of the crude and product markets has increased dramatically in the past 2 decades, with a resulting shift in operating strategies and profitability for refiners. The roster of industry participants is changing.
As rationalization characterized the 1980s, consolidation characterized the 1990s. In the broadest of perspectives, these evolving trends are characteristic of a commodity industry in a mature stage of its lifecycle.
US refining trends
One of the trends affecting the petroleum industry's competitive environment has been a substantial consolidation and restructuring of its downstream asset base. This has included mergers (on an international scale), acquisitions and divestitures of selected assets and operations, as well as abandonment of marginal and uneconomic processing facilities.
Since 1990, US refinery crude distillation capacity has grown by about 1 million b/d to the current level of slightly more than 16.6 million b/d. This growth is equivalent to 7% of the operating capacity that was in place at the beginning of 1990.
During the past 10 years, US capacity has been consolidated into fewer refineries and fewer refining companies. To illustrate, ten companies today account for approximately 70% of total US crude oil distillation capacity (11.6 million b/d). In 1990, 70% of US refining capacity (slightly less than 10.9 million b/d) was distributed among 14 companies.
The consolidation has contributed to a downward trend in operating costs and heightened the competitive pressure on refining margins.
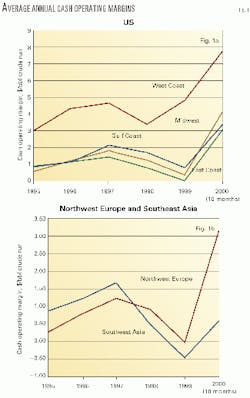
Fig. 1a shows the annual average cash-operating margins achieved by regional refiners in the US since 1995.
The term "cyclical" is sometimes used in describing refinery profitability. The term implies a degree of predictability and orderliness, however, that most refiners would agree does not exist.
The refining industry is characterized by operating margins that can swing dramatically from month to month, although there are seasonal demand factors that contribute to margin trends within a given year.
On a longer-term basis, refinery profitability does not follow definable cycles, but rather is influenced by a number of factors. These factors include fluctuations in crude price, crude and product inventory levels, rates of capital spending and capacity utilization, and product market variables-each of which can have a dramatic impact on refiners' profits.
All of the refining centers have experienced broadly similar profitability trends on an annual average basis over time. An examination of the trends, however, also reveals that West Coast refining is somewhat unique.
The closer alignment of refiners in the Gulf Coast, East Coast, and Midwest regions reflects the extensive refined products pipelines and logistics support systems that tie these major refining centers together. No similar ties to the West Coast exist.
Both the Midwest and East Coast markets lack sufficient indigenous refining capacity to meet their regional demands for refined products. Refiners in the Gulf Coast have traditionally served as the source for the incremental supplies of refined products to meet the needs of the Midwest and East Coast markets. Imports of refined products from refiners in Europe and the Caribbean region also serve the East Coast.
Prices for refined products in the US Gulf Coast, East Coast, and Midwest markets thus reflect the competitive dynamics of refinery operations throughout the Atlantic basin. Overall trends in refining profitability in each region, in turn, reflect the combined impact of refined-product prices along with regional crude oil costs and typical refinery efficiencies.
In contrast to the regional integration between refined products manufacturing and consuming sectors in areas east of the Rocky Mountains, the US West Coast can generally be characterized as a self-contained market.
Historically, West Coast refiners have satisfied the region's overall demand for refined products. More recently, however, the region's supply and demand balance has tightened, and unexpected refinery outages can lead to short-term price volatility.
European, Asian refining centers
Both crude and refined-products markets are global, with very few niche markets left in the world. As such, there are many refining centers scattered through the world that serve diverse markets. Such centers can be viewed in two broad perspectives:
- Centers that produce refined products primarily to satisfy the requirements of local markets. In these areas, refinery economic performance tends to reflect the specific regional competitive environment.
- Regions that contain significantly more refining capacity than needed for local markets (as is the case in the US Gulf Coast region) or regions that can be easily supplied by water or pipeline with refined products from other regions.
Refinery economic performance in these areas reflects the cumulative impact of the competitive environments in both local and other markets that either supply product or are served by the region's refineries.
Among the various major international refining centers, there are two areas that are generally considered as bellwethers of refinery economic performance:
- Northwest Europe in the region generally referred to as ARA (Amsterdam, Rotterdam, and Antwerp).
- Southeast Asia, serving markets throughout the Asia-Pacific region.
These two refining centers rely on diverse crude oil supply sources. They ship products to various consumer markets that depend on imports to satisfy their overall needs.
Thus, the supply, demand, and pricing dynamics for crude oil and refined products in Northwest Europe and Southeast Asia reflect a broad spectrum of the international refining competitive environment.
Fig. 1b shows the average cash-operating margins estimated for refiners operating in these two international export centers.
In 1988-94, conversion capacity in Europe increased significantly. Expressed as a portion of crude capacity, it rose from 23% to 31%, with much of the focus on catalytic cracking.
With crude capacity also increasing, combined with the availability of light crude oils and condensates, the industry experienced a substantial increase in its gasoline production capability.
By 1995, however, Europe was increasing its preference for diesel cars, driven by higher efficiency for diesels and tax incentives in a number of European countries.
This undermined the gasoline demand, and refiners are now struggling to meet the growing demand in distillate.
The surplus of gasoline led to the relatively poor economic performance in 1995-96.
Economics improved in 1997 and 1998, however, as supply tightened and domestic products' prices held a healthy premium over declining crude oil prices.
Also, the strong demand for gasoline in the US supported European exports.
By yearend 1998, high inventories started to erode refinery margins. Combined with the rapid increase in crude oil prices in early 1999, margins declined further, giving European refiners the worst economic performance of the decade.
As inventories were worked down, however, margins started to improve. In 2000, partly on the back of very strong US gasoline market, margins climbed to record highs.
Refiners in the Southeast Asia region have traditionally struggled with a very competitive market.
Nonetheless, optimistic expectations for economic growth during the early to mid-1990s in the Southeast Asia region contributed to aggressive plans for expanding refining capacity to meet the expected growth in demands for refined products.
Unfortunately, what the region ultimately experienced was a period characterized by little or no economic growth, and the expected growth in refined products demand did not materialize.
This situation has led to an extended period of losses for refiners in the Southeast Asia market. As has been the case elsewhere in the world, Southeast Asia refining margins have improved significantly during 2000.
This reflects the improved economic conditions in the region as well as the cancellation or deferral of refinery expansion investments that were previously committed.
The authors
Peter J. Killen is associated with Muse, Stancil & Co.'s Houston office, where he assisted in development of the refinery profitability series. He is involved in a variety of consulting activities for the hydrocarbon and processing related industries. Killen holds a BS in chemical engineering from the University of Detroit.
Kathy G. Spletter is a vice-president and director of Muse, Stancil & Co. and leads the valuation services practice area for Muse. She worked for Mobil Corp. prior to joining Muse in 1987 and has more than 20 years' experience in the energy industry. Spletter holds a BS in chemical engineering from Texas A&M University. She is a registered professional engineer in Texas and is an accredited senior appraiser of the American Society of Appraisers.
Neil K. Earnest is a vice-president and director with Muse, Stancil & Co. with a practice focus on the economic and technical analysis of the petroleum refining and marketing sector. Prior to joining Muse in 1991, he was with Phillips Petroleum Co. for 11 years where he held a variety of refinery and headquarters positions. Earnest holds a BS in chemical engineering and an MBA. He is a registered professional engineer in Texas.
Bradford L. Stults has 17 years' experience in the petroleum and refining industry including refinery operations planning and capital project justification. His special focus is long-term petroleum industry forecasting and pricing. Before joining Muse Stancil & Co., he was with Koch Refining Co. as director of petroleum economics. Stults holds a BS and an MS in mathematics.


