Risk-based model aids selection of pipeline inspection, maintenance strategies
The existing method of pipeline monitoring, which requires an entire pipeline to be inspected periodically, wastes time and is expensive.
A risk-based model that reduces the amount of time spent on inspection has been developed.
This model not only reduces the cost of maintaining petroleum pipelines, but also suggests an efficient design and operation philosophy, construction method, and logical insurance plans.
The risk-based model uses analytic hierarchy process (AHP), a multiple attribute decision-making technique, to identify factors that influence failure on specific segments and analyze their effects by determining the probabilities of risk factors.
The severity of failure is determined through consequence analysis, which establishes the effect of a failure in terms of cost caused by each risk factor and determines the cumulative effect of failure through probability analysis.
The technique does not totally eliminate subjectivity but improves upon the existing inspection method.
Defining 'failure'
Cross-country pipelines are the most energy-efficient, safe, environmentally friendly, and economic way to ship hydrocarbons (gas, crude oil, and finished products) over long distances, either within the geographical boundary of a country or beyond it.
Significant portions of many nations' energy requirements are now transported through pipelines. With the economies of many countries depending on the smooth and uninterrupted operation of these lines, it is increasingly important to ensure the safe and failure-free operation of pipelines.
Although pipelines are one of the safest modes of transporting bulk energy and have failure rates much lower than railroads or highway transportation, failures do occur, sometimes catastrophically.
Several pipelines have failed recently, with tragic consequences. In 1993 in Venezuela, 51 people were burned to death when a gas pipeline failed and the escaping gas ignited. Again in 1994, a 36-in. (914 mm) pipeline in New Jersey failed, resulting in the death of one person and more than 50 injuries. Similar failures also have occurred in the UK, Russia, Canada, Pakistan, and India.1
While pipeline failure rarely cause fatalities, disruptions in operation lead to large business losses. Failures can be very expensive and cause considerable damage to the environment.
Use of the term "failure" in the context of pipelines varies from country to country and across organizations.
In Western Europe, for example, any loss of gas or oil is considered a failure, while an incident in the US is considered a failure only when it is associated with the loss of commodity and also involves a fatality or injury, or damage of more than $50,000.2
In India, generally any loss of commodity, however small, is considered a failure if from a pipeline that is engaged in the transportation of that commodity.
Traditionally, most pipeline operators ensure that during design, safety provisions are created to provide a theoretical minimum failure rate for the life of the pipeline. Safety provisions govern selection of pipes and other fittings.
To prevent corrosion, high-resistance external coating materials electrically isolate a pipeline. As a secondary protective measure, a low-voltage direct current is impressed in the pipe at precalculated distances to transfer any corrosion that occurs as a result of breaks in the coating from buried iron junk, rails, etc. This is called impressed-current cathodic protection.
The quality of the commodity being transported through the line is also ensured; sometimes corrosion-preventing chemicals (corrosion inhibitors) are mixed with the commodity. Regular patrolling of the right-of-way from the air as well as on foot helps prevent deliberate damage of the pipeline in isolated locations; all third-party activities near the route are monitored.
Various techniques are routinely used to monitor the status of a pipeline. Any deterioration in the line may cause a leak or rupture. Modern methodologies can ensure the structural integrity of an operating pipeline without its being taken out of service.3
Existing inspection and maintenance practices commonly followed by most pipeline operators are formulated mainly on the basis of experience. Operators, however, are developing an organized maintenance policy based on data analysis and other in-house studies to replace rule-of-thumb based policies.
The primary reasons for this are stringent environmental protection laws,4 scarce resources, and excessive inspection costs. Existing policies are not sharply focused from the point of view of the greatest damage-defect risk to a pipeline.
The basis for selecting health monitoring and inspection techniques is not very clear to many operators. In many cases, a survey is conducted over an entire pipeline or on a particular segment, when another segment needs its more. Avoidable expenditures are thus incurred.
A strong reason exists, therefore, to derive a technique that will help pipeline operators select the right type of inspection-monitoring technique for segments that need it. A more clearly focused inspection and maintenance policy that has a low investment-to-benefit ratio should be formulated.
This article introduces a model for predicting the risk factor for pipeline failures. This model allows management to formulate a cost-effective, customized, flexible, and logical inspection model. It is established through risk analysis, with application of the analytic hierarchy process (AHP), a multiple attribute decision-making technique.5
Researchers and practitioners use AHP in various industrial applications. Partovi used it for operations management decision-making.6 Dey used it in managing the risk of projects.7 Mustafa and Ryan used it in bid evaluation problem.8
Mian and Christine and Dey used it in project evaluation and selection.4 9 Dey and Gupta used it for pipeline route selection (OGJ, May 29, 2000, p. 68).
To author's knowledge, this study is the first application AHP in maintenance practices in oil pipelines.
This study reveals the effect of certain risk factors on the failure of pipelines and pipeline sections and derives a risk management policy. It has the following objectives:
- Predict the greatest risk factors.
- Analyze the effect of risk factors on pipeline failures.
- Respond to risk through an appropriate inspection and maintenance program.
- Analyze the costs and benefits to justify the investment in preparation.
- Rationalize insurance premium.
- Suggest improvement in design, construction, and operation of pipelines.
Analytic hierarchy process
Risks are by nature subjective. Analysis of their potential of contributing to a failure, therefore, led to the analytic hierarchy process to be developed by Saaty.5 This technique allows subjective and objective factors to be considered in risk analysis and also provides a flexible and easily understood way to analyze subjective risk factors.
It is a multiple criteria decision-making technique that permits the active participation of those involved and provides managers a rational basis on which to make decisions.
Forming the decision problem in a hierarchical structure is the first step. In a typical hierarchy, the top level reflects the overall objective (focus) of the decision problem. The elements affecting the decision are represented in intermediate levels. The lowest level comprises the decision options.
Once the hierarchy has been constructed, the decision-maker begins the prioritization procedure to determine the relative importance of the elements in each level of the hierarchy. These elements are compared pair-wise with respect to their importance in the making of the decision under consideration.
The verbal scale used in AHP enables the decision-maker to incorporate subjectivity, experience, and knowledge intuitively and naturally.
After the comparison matrices have been created, the process moves on to the phase in which relative weights are derived for the various elements. The relative weights of the elements of each level with respect to an element in the adjacent upper level are computed as the components of the normalized eigenvector associated with the largest eigenvalue of their comparison matrix.
The composite weights of the decision alternatives are then determined by aggregating the weights through the hierarchy. This is done by following a path from the top of the hierarchy to each alternative at the lowest level and multiplying the weights along each segment of the path.
The outcome of this aggregation is a normalized vector of the overall weights of the options. The mathematical basis for determining the weights has been established by Saaty.5
Methodology
The methodology adopted in this study involves ten steps:
1. The entire pipeline is classified into a few segments (preferably in line with its natural segment, that is, the pipeline sections between two stations).
2. All information related to the pipeline including the terrain detail under study is prepared and documented.
3. This step identifies the risk factors that can cause failures. Generally, pipelines fail because of one of five reasons: corrosion; external interference; construction and materials defects; acts of God; or human and operational error.
One of the major causes of pipeline failure is corrosion,10 11 an electro-chemical process that changes metal back to ore. Corrosion generally takes place when there is a difference of potential between two areas having a path for the flow of current. Due to this flow, one of the areas loses metal.
External interference is another leading cause of pipeline failure.10 11 It can be malicious (sabotage or pilferage) or be caused by other agencies sharing the same utility corridor. The latter is known as "third-party" activity. In both cases, a pipeline can be damaged severely.
External interference with malicious intent is more common in socio-economically backward areas, while in regions with more industrial activity, third-party damage is common.
All activities, industrial or otherwise, are prone to natural calamities, but pipelines are especially vulnerable. A pipeline passes through all types of terrain, including geologically sensitive areas. Earthquakes, landslides, floods, and other natural disasters are common reasons for pipeline failures.
Poor construction, combined with inadequate inspections and low-quality materials, also contributes to pipeline failures. Other reasons include human and operational error and equipment malfunctions.12 Computerized control systems considerably reduce the chance of failure from these factors.
Human and operational errors make up another source of pipeline failure. Inadequate instrumentation, lack of standardized operating procedures, untrained operators, etc. are the common causes of pipeline failure due to human and operational errors.
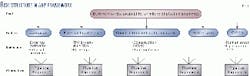
4. The next step of this methodology is the formation of a risk structure model in the AHP framework. Based on the identified risk factors, a hierarchical risk structure is formed (Fig. 1). In the context of our study, the goal is to determine the relative the likelihood of pipeline failures.
Level II consists of criteria (risk factors), Level III sub-factors, and Level IV alternatives (the pipeline segments). Fig. 1 shows the AHP model for analyzing risk from a failure perspective.
5. This is a comparison by pairs of risk factors and sub-factors to determine the likelihood of pipeline failure due to each factors and sub-factors.
6. This step is a pair-wise comparison of alternative pipeline segments, with respect to each risk factor, to determine the likelihood of failure for each pipeline segment due to each factor.
7. This step includes synthesizing the results across the hierarchy to determine the likelihood of failure of a pipeline segment and relative comparison with other segments from failure perspectives.
8. This step determines specific inspection, maintenance requirements for specific segments, to mitigate risk.
9. This step determines the expected failure cost of each line by a Monte Carlo simulation.
10. The last step is to establish a cost-benefit analysis to justify the proposed investment, to suggest design, construction, and operation improvement of future pipelines and to formulate a cost-effective insurance plan for pipeline.
Application
The entire methodology has been illustrated by a case study application.
A 1,500-km crude oil pipeline in the western part of India was studied. The throughput of the pipeline is 9 million tonnes/year with augmentation capability of 12 tonnes/year, having three intermediate booster stations and an offshore terminal.
This 19-year-old pipeline has a history of corrosion failure. The poor condition of the coating, as revealed during various surveys, and an unreliable power supply to cathodic-protection stations are the reasons.
The line passes through long stretches of socio-economically backward areas and is vulnerable to pilferage and sabotage. In some regions, the right-of-way is shared with other agencies, making the chance of external interference high. Failure data revealed numerous pre-commissioning failures, raising doubts about the quality of construction.
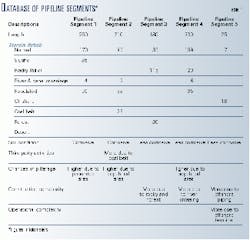
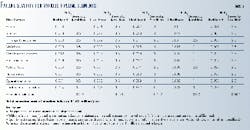
Applying the methodology described formulates the risk analysis model for the pipeline. The entire pipeline was classified into five segments. The risk structure and pair-wise comparisons were established through a workshop of the about 30 executives who operate various pipelines.
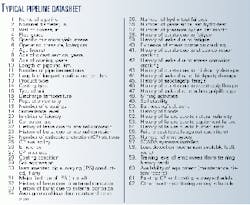
Before formulating the model, they were given full knowledge of pipeline conditions through the database of various pipeline segments (Table 1) and pipeline record sheet (shown in the accompanying box).
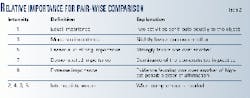
A decision-maker can express a preference between each pair as equal, moderate, strong, very strong, and extremely preferable (important). These judgments can be translated into numerical values on a scale of 1 to 9 (Table 2).
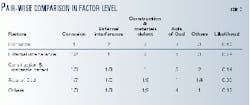
Elements at each level of hierarchy are compared with each other in pairs, with their respective "parents" at the next higher level. With the hierarchy used here, matrices of judgments are formed. A brainstorming session was held to compare the risk factors. Table 3 shows the matrix of judgments that resulted.
Table 4 summarizes the final outcomes of each pipeline segment against the risk factors. Both local probability and global probability for each of the five segments are summed up to yield the probability of a pipeline segment failure and its position with respect to other segments.
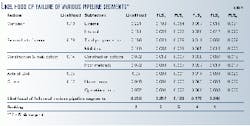
The results of the analysis (Table 4) reveal that the chances of pipeline failure due to corrosion and external interference are greater than other factors.
The following additional observations were made from the risk analysis study:
- Pipeline Segments 1 and 2 are vulnerable from external corrosion due to slushy terrain, whereas pipeline Segments 4 and 5 are vulnerable to internal corrosion due to long submerged pipe sections.
- External interference due to third-party activities constitute a major problem in pipeline Segment 2 because of coal mining activities, whereas in Segment 4, the problem results from major river crossings and a canal crossing.
- External interference due to maliciousness prevails in Segment 2 because it passes through a long and highly populated industrial areas.
- The pipeline Segment 3 passes through mostly rocky terrain, exposing the pipe to various types of failure due to construction and poor materials. As this segment is vulnerable to subsidence, the likelihood of pipeline failure from acts of God is quite high.
- Segment 5, the offshore pipeline, is very sensitive to operational and human errors as well as failure due to various natural calamities.
All pipeline segments are ranked with respect to their failure chances, pipeline Segment 5 comes first, pipeline Segment 1 comes second, and pipeline Segments 2, 4, and 3 come third, fourth, and fifth, respectively.
Selecting strategies
The output of this analysis helps in deciding specific inspection and maintenance programs for each pipeline segment.
Instrument pig survey has been suggested for pipeline Segments 4 and 5 to detect internal corrosion. A survey was chosen to reveal areas affected by external corrosion. One technique is a current-attenuation survey or Pearson survey, which detects breaks in pipeline coating where the pipeline is exposed to soil.
Survey techniques that can identify both internal and external corrosion are unnecessary and not cost effective.
Pipeline Segments 1, 2, and 3 are prone to external interference (pilferage and sabotage) and require frequent patrolling.
Segments 2 and 4 are susceptible to third-party damage. Therefore, more publicity about the route among agencies working near it could be a solution. Cooperation with these agencies needs to be improved. Contingency plans for handling situations of failure, however, are to be kept ready for the above two segments.
Pipeline Segments 3 and 5 are vulnerable to normal and abnormal natural calamities. Although various measures were taken in designing and constructing the pipelines in both the segments for minimizing failure, a few contingency plans are also to be formulated in line with the anticipated incidents.
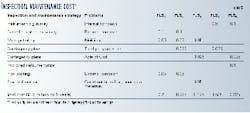
Table 5 indicates the inspection and maintenance programs for the pipeline under study vis-a-vis cost for each program. Table 6 indicates the conventional inspection and maintenance programs vis-a-vis cost in absence of the proposed risk-based model. This establishes the advantage of using the risk-based model in designing inspection and maintenance of cross-country petroleum pipeline.

Selection of a particular inspection technique depends on the owner's experience. This approach, however, will provide a rational basis for the owner's selection of the most appropriate survey technique as well as the pipeline segment where the survey is most needed.
Expected failure cost
Generally, a pipeline failure involves various costs that are difficult to compute. Each cost component is unique to specific failure and depends upon such factors as the magnitude, area, and time of the failure, where it happens, and others.
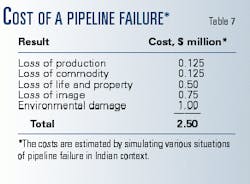
Table 7 shows a broad classification involving the various possible factors. The amounts shown in each of these categories are the estimated maximum failure costs. These factors depend on various sub-factors and parameters.
For the purpose of this article, a typical pipeline was considered. The cost encountered in this case (maximum) was estimated for India. An analysis of 20 years of failure expenditure data for the pipeline was conducted and suitable escalation applied wherever necessary on the basis of published literature and increases in the cost of various commodities.
The failures are classified (on the basis of cost incurred) into four categories:
- Small: up to $500,000.
- Medium: $500,000-1 million.
- Large: $1-1.75 million.
- Very large: up to $2.5 million.
The probability of failure in each of these four categories is considered, along with the cost of failure. A brainstorming session by the executives estimated the severity of failure of various pipeline segments. Table 8 shows the outcomes, tabulated along with the likelihood of occurrences of various risk factors (previously determined).
A Monte Carlo simulation was performed with the PC-based software Micro-Manager.
Table 8 shows the expected cost of failure for each segment. Skilled personnel are needed to compute costs against each of the factors shown in Table 7.
The cost of environmental damage varies from place to place; readers are therefore cautioned to use their own experience and expertise when estimating the cost of a pipeline failure.
Table 6 shows the conventional inspection and maintenance cost without use of risk-based model. The present proposed method has the potential to reduce costs and is thus preferred over conventional method.
Pipeline insurance plan
This study establishes a cost-effective insurance plan for the pipeline under study. The basis of the insurance premium depends on likelihood of the pipeline's failure, expected failure cost in a given period, risk perception of the management or organization, and the inspection or maintenance programs undertaken.
In this case study, the maximum amount of insurance premium for the pipeline under study would be the expected failure cost per year, that is, $1.6 million without any inspection and maintenance, as indicated in Table 8.
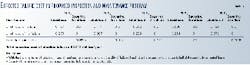
If the pipeline operators undertake the inspection and maintenance program in line with Table 5, the likelihood and severity both decrease considerably. The expected cost of failure would fall to $0.212 million (Table 9).
Hence, the annual insurance premium would lie between $1.6 and 0.212 million in line with management risk perception.
Improvements
The following suggestions emerged from the study:
- Pipeline routes are to be decided on the basis of life-cycle costing approach, not on the basis of shortest route. Dey and Gupta have shown one such approach (OGJ, May 29, 2000, p. 68).
- The maintenance characteristics of the pipeline are to be considered along with pressure and temperature parameters during design of pipe thicknesses for various segments of pipeline.
- Pipeline coating shall be selected on the basis of terrain condition, environmental policy of the organization, cost of coating materials, construction methodology, and inspection and maintenance philosophy.
- Construction methodology of pipeline in critical section should be formulated during feasibility stage of the project and be commensurate with the design and operational philosophy of the pipeline as a whole.
Such factors as availability of technology, availability of consultants, contractors and vendors, experience of owner project group, government regulations, and environmental requirements are to be rationally considered during selection of the best construction method.
- Networking in pipeline operations demands a foolproof mechanism in the system for minimizing operational and human errors. Improved instrumentation shall be designed which is commensurate with the design philosophy of entire pipeline system.
- All pipeline operators are to be suitably trained in pipeline operations before taking charge of working in specific pipelines. Pipeline simulation training may be one of these tools. Criticality of pipelines and expertise of personnel are to be considered for manning pipeline operations.
Advantages, limitations
Advantages of the method of analysis described here include the following:
*Reducing subjectivity in the decision making process when selecting an inspection technique.
- Identification of the right pipeline or segment for inspection and maintenance.
- Formulation of an inspection and maintenance policy.
- Derivation of the budget allocation for inspection and maintenance.
- Providing guidance for deployment of the right mix of labor in inspection and maintenance.
- Enhancing emergency preparations.
- Assessment of risk and fixing an insurance premium.
- Formation of a basis for demonstrating the risk level to governments and other regulatory agencies.
The technique does have limitations, however, because subjectivity is not totally eliminated. For instance, the weight against each of the failure factors is based upon experience and available data.
Despite these limitations, a cross-country petroleum pipeline inspection and maintenance policy formed on the basis of this methodology is effective in mitigating risk. It is cost effective and environmentally friendly.
References
- Hopkins, P., "Ensuring the Safe Operation of Older Pipelines," International Pipelines and Offshore Contractors Association, 28th Convention, September 1994.
- Hazardous Liquid Pipeline Risk Assessment, Office of State Fire Marshal, 1990, Sacramento, Calif.
- Jamieson, R.M., Pipeline Integrity Monitoring, Pipeline Integrity Conference, Aberdeen, Oct. 29-30, 1986.
- Mian, S.A., and Christine, N.D., "Decision-making over the project life cycle: an analytical hierarchy approach," Project Management Journal, Vol. 30 (1999), No. 1. pp. 40-52.
- Saaty, T.L., The Analytic Hierarchy Process, New York, McGraw-Hill, 1980.
- Partovi, F.Y., Burton, J., and Banerjee, A., "Application analytic hierarchy process in operations management," International Journal of Operations and Production Management, Vol. 10 (1990), No. 3, pp. 5-19.
- Dey, P.K., Tabucanon, M.T., and Ogunlana, S.O., "Planning for project control through risk analysis: a case of petroleum pipeline laying project," International Journal of Project Management, Vol. 12 (1994). No. 1, pp. 23-33.
- Mustafa, M.A., and Ryan, T.C., "Decision support for bid evaluation," International Journal of Project Management, Vol. 8 (1990), No. 4, pp. 230-35.
- Dey, P.K., "Integrated approach to project feasibility analysis: a case study," Impact Assessment and Project Appraisal, forthcoming 2001.
- Annual Report of CONCAWE. Brussels (Conservation of Clean Air and Water, Europe), 1994.
- Oil Industry Pipeline Leakage Survey, Pipes and Pipelines International, January-February 1993.
- US Department of Transportation, Pipeline Safety Regulations, Oct. 1, 1995.
The author

Prasanta Kumar Dey is a lecturer in the department of management studies of the University of the West Indies, Cave Hill Campus, Barbados. Before joining the department, he was with Indian Oil Corp. Ltd., New Delhi, for 14 years. He holds a doctorate in operations and production management from Jadavpur University, Calcutta, a masters in industrial engineering and management from Asian Institute of Technology, Bangkok, and a bachelors in mechanical engineering from Jadavpur University.

Saumitro Sankar Gupta is an inspection manager in the pipeline division of Indian Oil Corp. Ltd., Noida, India. He joined Indian Oil in 1985 and was named to his present position in 1998. Gupta holds a bachelors (1984) from Punjab University, Chandigarh, India, in metallurgical engineering.