How integrated modeling assisted with Navigator find, Midland basin eastern shelf
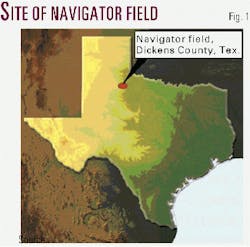
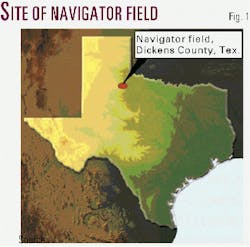
Navigator field is in Dickens County, Tex., 91/2 miles southeast of Spur, along the northeastern end of the eastern shelf of the Midland basin (Fig. 1). The field produces from a Lower Permian Tannehill sandstone unit at 4,400 ft.
Navigator field was cost-effectively discovered and developed using a synergistic, integrated modeling approach1 that consisted of geomorphology, subsurface geology, near-surface geochemistry, electric logs, sidewall cores, FMS-FMI dipmeter data, and other exploration tools.
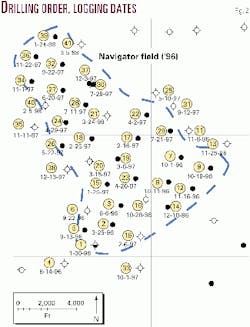
This article covers the time from December 1995 and the drilling of the first well until July 1998. During this period 24 successful wells were drilled, producing a total of 750,000 bbl of oil (Fig. 2). Navigator field is expected to yield more than 4 million bbl of oil after secondary recovery.2
Burk-Gunn Oil Co. purchased Navigator field in July 1998 and later unitized field acreage for pressure maintenance and eventual secondary recovery.
Navigator discovery
Subsurface geology
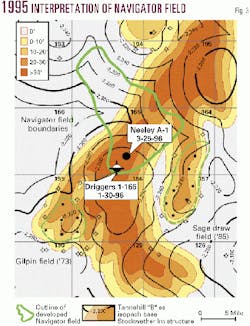
In July 1995 with the use of well control and the senior author's years of experience with the Tannehill depositional environment, a structure map on the base of the Stockwether lime and isopach map for the Tannehill B sandstone unit were developed as the most current geological framework (Fig. 3).
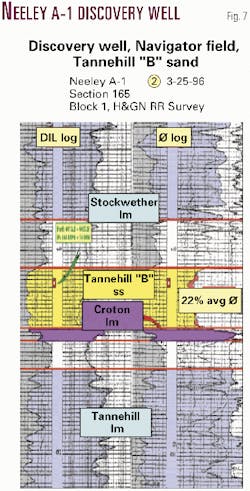
Of the three Tannehill sandstone units located stratigraphically between the Stockwether lime and Croton lime, the Tannehill B sandstone is the most pervasive. Data collected from sidewall cores, dipmeters (FMS-FMI), and electric logs indicate the Tannehill B sandstone was deposited during a regressive, fluvial-deltaic sedimentation cycle and encased between two transgressive limestone units.
Interstitial soil gas analysis
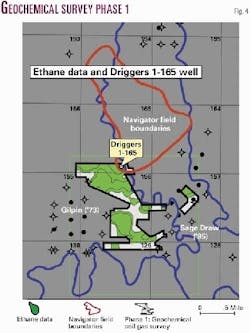
A phase 1 geochemical survey was subsequently conducted using interstitial soil gas analysis from samples collected at a depth of 10 ft (Fig. 4). Soil gas samples were analyzed on a gas chromatograph (GC) equipped with a flame ionization detector (FID) for low-molecular-weight hydrocarbons, methane through n-butane.
Ethane concentration data were selected as the mapping parameter. Ethane is a thermogenic hydrocarbon indigenous to petroleum sources at depth.3 Ethane migrates in a gas phase vertically along both microfractures and macrofractures into the pore spaces of near-surface soils.4
Integrated model
Integrated modeling requires understanding the correlation between the subsurface geology, geomorphology, dipmeter information (if available), geochemical data, electric logs, sidewall cores, and other exploration tools.
All information is integrated in a continuous synergistic process; none is used as autonomous data sets. The interpreted model must make logical reservoir and geological sense.5 6
Also, years of experience in the Tannehill "play" proved invaluable during model development. The senior author's previous success and awareness of the structural complications caused by differential compaction on the potential reservoir sands and resulting impact on subtle structures7 8 was critical before deciding on the first drilling location.
It is interesting to note that the average Tannehill field has less than 30 ft of closure.
First drilling location
In an effort to make drilling a wildcat on the Navigator prospect financially attractive to investors, it was important to analyze and duplicate the depositional environment of adjacent Sage Draw field.
Therefore, the first drilling location, Driggers 1-165, was chosen based on:
- Subsurface geological evaluation composed of multiple cross-sections resulting in structure mapping on the base of the Stockwether lime with isopach mapping of the Tannehill B sandstone (Fig. 3), and
- Significant ethane concentration data trends from the phase 1 geochemical survey (Fig. 4) that were congruent with the depositional environment.
The 1995 subsurface geological interpretation predicted the possibility of being structurally high and a probability of significant Tannehill sandstone thickness at this location (Fig. 3). Driggers 1-165 was found to be structurally higher than predicted, based on the Stockwether lime, and there was significant thickness of Tannehill sand and an excellent "show" in the Tannehill B sandstone unit. The FMSs dipmeter data indicated current direction was to the southwest and lateral accretion was southeast (Fig. 5), with structure on top of sand predicted to come up to the northeast.
Discovery well
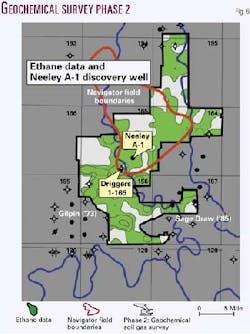
Prior to selecting the next drilling location, a phase 2 geochemical survey was conducted. The phase 2 geochemical survey primarily extended the phase 1 survey to the north and east.
Both surveys indicated significant ethane concentration data trends to the north and northeast (Fig. 6).
Therefore, based on the Driggers 1-165 FMS dipmeter data and supporting ethane concentration data to the north, the decision was made to drill a location 1,250 ft northeast of the Driggers 1-165 "show well."
In two months the Neeley A-1 was drilled (Figs. 3, 6). The electric log for the Neeley A-1 discovery well is used as the type log for the field showing the stratigraphic units (Fig. 7). Neeley A-1 encountered 28 ft of Tannehill sandstone at a depth of 4,408 ft with a potential of 167 b/d of oil plus 16 b/d of water on pump. Another graphic shows general information about the discovery well and Navigator field (Fig. 8).9
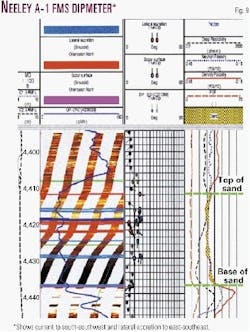
The Neeley A-1 FMI dipmeter data indicated current direction was to the south-southwest and lateral accretion was east-southeast (Fig. 9). The data also indicated the Neeley A-1 location was near the edge of the Tannehill sand bar. However, even though the electric log data indicated the base of the Stockwether lime was virtually flat between the Driggers 1-165 "show well" and the Neeley A-1 "discovery well," it also reflected a gain in structure based on the top of the Tannehill sandstone moving from the "show well" to the "discovery well."
Therefore, based on the geological information and supported by the ethane concentration data trend to the north and northeast, the decision was later made to drill more locations north and northeast of the discovery well. This resulted in future productive trends to the north of the Neeley A-1 well.
Navigator development (1996-98)
Multiple geochemical analyses
To help delineate the boundaries and trend of the Tannehill sandstone reservoir, the decision was made to:
Other science
In studying the geomorphology after drilling the Neeley A-1 well, a topographic rise was observed north of the discovery well. This topographic high was bound on the west by Sage Draw Creek and the east by Dry Duck Creek (Fig. 10).
Experience with Tannehill prospects suggested that macrofractures are probably due to differential forces, e.g. loading and compaction. These larger macrofractures in the form of shear-fractures, joints, and-or faults usually develop close to the structural flanks and along lithofacies boundaries. Many times these structural features correlate to surface drainage patterns.12
Understanding the mechanics of mass transport, or how each hydrocarbon type (paraffin gases and aromatics) migrates from the reservoir to the surface is essential for integrating and modeling the geochemical data with subsurface geology and geomorphology.
The lighter paraffin gases, e.g. ethane data, may indicate both microfractures and macrofractions, whereas the heavier aromatic data require larger conduits.13 14 Therefore, the heavier aromatic data may indicate the approximate location of the structural flanks and possible boundaries of the Tannehill field.
Fig. 11 shows the combined ethane and aromatic data. The aromatic data trends indicate the approximate structural flanks, boundaries of the field, and show good geomorphological correlation between Sage Draw Creek (west) and Dry Duck Creek (east), indicating macroseepage of the heavier aromatics along the larger macrofractures.
The ethane data are also congruent with the aromatic data. However, the spatial extent of the ethane data extends distally from the aromatic trends and becomes attenuated near the structural crest of the plunging Stockwether lime feature. These attenuated ethane data indicate a "thinning" or "shaled-out" Tannehill reservoir near the crest of the structure.15
Field development
Fig. 12 shows a structure map on the base of the Stockwether lime and Tannehill B sandstone isopach map developed from extensive well control.
Subsequent field development indicated:
- Southerly plunging north-south structure based on the Stockwether lime.
- Thinning or shaled-out Tannehill sandstone reservoir near the crest of the structure.
- Geomorphic high corresponds to the subsurface structurally-high feature, and the two drainage patterns (Sage Draw and Dry Duck Creeks) reflect the structural flanks.
- Structurally-low Stockwether lime feature predicted in the 1995 interpretation, Fig. 3, was actually found to be structurally high (Fig. 12).
- Interpretation of aromatic data in delineating the structural flanks and approximate field boundaries was correct.
- Ethane data helped determine drilling locations and correctly predicted a thinning or shaling-out of the Tannehill sandstone reservoir near the structural crest.
Fig. 13 shows a west to east (A-A') and Fig. 14 a north to south (B-B') structural log profile through Navigator field.
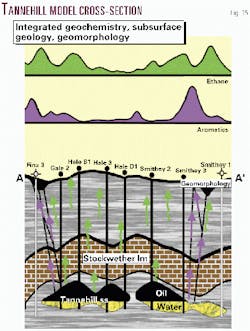
Fig. 15 is the geological model developed along the west to east (A-A') profile line integrating the subsurface Stockwether lime structure, Tannehill sandstone isopach, geomorphology, and two geochemical data sets.
Analysis
The successful exploration tool of the future will not be a single tool or technique. Success will be measured through the ability to properly integrate, develop, and implement logical models based on high-quality data.
Discovery and development of Navigator field required a thorough understanding and evaluation of the regional geology and depositional environments. The next and crucial step in the process was developing and implementing a logical model from properly integrated high-quality data. F
References
- Belt, John Q. Jr., and Rice, Gary K., "Macro exploration modeling: a pragmatic, multidisciplinary team process," OGJ, June 5, 1995, pp. 43-45.
- Cannon, Robert A., "Navigator field, Dickens County, Texas-a case of integration," AAPG-Southwest Section convention abs., Abilene, Tex., 1999.
- Hunt, John M., "Petroleum geochemistry and geology," W.H. Freeman & Co., San Francisco, 1979, pp. 28-66.
- Klusman, Ronald W., and Saaed, Mahyoug A., "Comparison of light hydrocarbon microseepage mechanisms," in Schumacher, Dietmar, and Abrams, Michael A., eds., "Hydrocarbon migration and its near-surface expression," AAPG Memoir 66, 1996, pp. 157-168.
- Rice, Gary K., and Belt, John Q. Jr., "Modern interpretation and integration by modeling near-surface geochemical data," AAPG annual convention abs., New Orleans, 2000.
- Rice, Gary K., and Belt, John Q. Jr., "Surface geochemical information in petroleum exploration integration," AAPG Southwest Section abs., Dallas, 2001.
- Billings, Marchand P., "Structural geology," Prentice-Hall Inc., Englewood Cliffs, N.J., 1952, p. 7-241.
- Reading, Harold G., "Sedimentary environments and facies," Blackwell Scientific Publications, Oxford, England, 1978, pp. 4-60 and 97-175.
- Cannon, Robert A., "Navigator field, Dickens County, Texas-a case of integration," AAPG annual convention abs., San Antonio, 1999.
- Belt, John Q. Jr., and Rice, Gary K., "Quantifying polynuclear aromatic compounds helps locate major structural fractures for prospect evaluation," AAPG annual convention abs., Salt Lake City, 1998.
- Belt, John Q. Jr., and Rice, Gary K., "Low-cost quantified fluorescence analysis of soils helps evaluate the hydrocarbon potential of oil & gas prospects," AAPG Southwest Section convention abs., Abilene, Tex., 1999.
- Belt, John Q. Jr., and Rice, Gary K., "Integrated reconnaissance model scores on Midland basin eastern shelf," OGJ, Mar. 13, 2000, pp. 43-45.
- Belt, John Q. Jr., and Rice, Gary K., "Offshore 3D seismic, geochemical data integration, Main Pass project, Gulf of Mexico," OGJ, Apr. 1, 1996, pp. 76-81.
- Belt, John Q. Jr., and Rice, Gary K., "Advantages seen in integrated offshore 3D seismic, geochem data," OGJ, Apr. 8, 1996, pp. 100-102.
- Rice, Gary K., and Jackson, Vernon H., "Geochemical techniques in exploration," ASP-ACSM fall convention, San Antonio, September 1984.
The authors
Robert A. Cannon has more than 25 years of exploration experience with Texas Pacific Oil Co., Sun Oil Co., Oryx Energy Co., and as a consultant. He used the modeling methodologies described in this article to discover and develop fields such as Christopher, INS, Jayton East, and Guthrie Southwest. He has a BS degree in geology from Abilene Christian University. E-mail: [email protected]
Gary K. Rice is president of GeoFrontiers Corp., Dallas. He managed geochemical technologies for more than 25 years in Texas Instruments (GSI), Halliburton Geophysical Services, and GeoFrontiers. He has BS and PhD degrees in chemistry from Oklahoma State University.
John Q. Belt Jr. is a geologist and vice-president of GeoFrontiers. He has more than 26 years' experience managing petrochemical and geochemical exploration laboratories and served in various quality control positions such as team leader, auditor, and director with ARCO Chemical Co., Halliburton Geophysical Services, and GeoFrontiers. He has a BS degree in geology from Lamar University and other degrees in human relations and international business. E-mail: [email protected]
